But that gives the total amount of waits for each wait type accumulated since the server was started. And that isn’t ideal when I’m troubleshooting trouble that started recently. No worries, Paul also has another fantastic post Capturing wait statistics for a period of time.
Taking that idea further, I can collect data all the time and look at it historically, or just for a baseline. Lot’s of monitoring tools do this already, but here’s what I’ve written:
Mostly I’m creating these scripts for me. I’ve created a version of these a few times now and some reason, I can’t find them each time I need them again!
This stuff can be super useful, especially, if you combine it with a visualization tool (like PowerBI or even Excel).
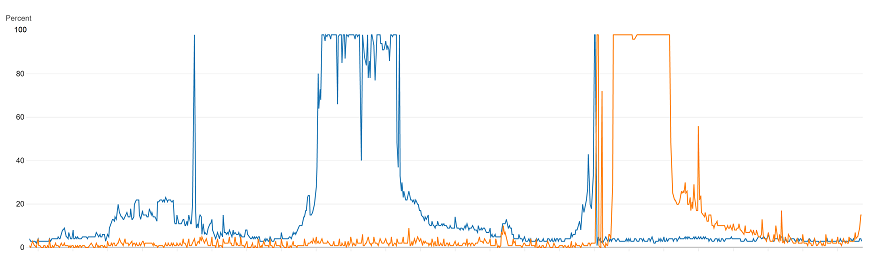
For example, here’s a chart I made when we were experiencing the XVB_LIST spinlock issues I wrote about not too long ago. Good visualizations can really tell powerful stories.
I’m talking here about spins and not waits of course, but the idea is the same and I’ve included the spinlock monitoring scripts in the same repo on github.
Scaling SQL Server High
The beginning of the school year is behind us and what a semester start! 2020 has been tough on many of us and I’m fortunate to work for a company whose services are in such high demand. In fact we’ve seen some scaling challenges like we’ve never seen before. I want to talk about some of them.
Detect Excessive Spinlock Contention on SQL Server
Context
As we prepared to face unprecedented demand this year, we began to think about whether bigger is better. Worried about CPU limits, we looked to what AWS had to offer in terms of their instance sizes.
We were already running our largest SQL Servers on r5 instances with 96 logical CPUs. But we decided to evaluate the pricy u instances which have 448 logical CPUs and a huge amount of memory.
Painful Symptoms
Well, bigger is not always better. We discovered that as we increased the load on the u-series servers, there would come a point where all processors would jump to 100% and stayed there. You could say it plateaued (based on the graph, would that be a plateau? A mesa? Or a butte?)
When that occurred, the number of batch requests that the server could handle dropped significantly. So we saw more CPU use, but less work was getting done.
The high demand kept the CPU at 100% with no relief until the demand decreased. When that happened, the database seemed to recover. Throughput was restored and the database’s metrics became healthy again. During this trouble we looked at everything including the number of spins reported in the sys.dm_os_spinlock_stats dmv.
The spins and backoffs reported seemed extremely high, especially for the category “XVB_LIST”, but we didn’t really have a baseline to tell whether those numbers were problematic. Even after capturing the numbers and visualizing them we saw larger than linear increases as demand increased, but were those increases excessive?
How To Tell For Sure
Chris Adkin has a post Diagnosing Spinlock Problems By Doing The Math. He explains why spinlocks are useful. It doesn’t seem like a while loop that chews up CPU could improve performance, but it actually does when it helps avoid context switches. He gives a formula to help find how much of the total CPU is spent spinning. That percentage can then help decide whether the spinning is excessive.
But I made a tiny tweak to his formula and I wrote a script to have SQL Server do the math:
You still have to give the number of CPUs on your server. If you don’t have those numbers handy, you can get them from SQL Server’s log. I include one of Glenn Berry’s diagnostic queries for that.
There’s an assumption in Chris’s calculation that one spin consumes one CPU clock cycle. A spin is really cheap (because it can use the test-and-set instruction), but it probably consumes more than one clock cycle. I assume four, but I have no idea what the actual value is.
EXEC sys.xp_readerrorlog 0, 1, N'detected', N'socket';
-- SQL Server detected 2 sockets with 24 cores per socket ...

declare @Sockets int = 2;
declare @PhysicalCoresPerSocket int = 24;
declare @TicksPerSpin int = 4;

declare @SpinlockSnapshot TABLE (
    SpinLockName VARCHAR(100),
    SpinTotal BIGINT
);

INSERT @SpinlockSnapshot ( SpinLockName, SpinTotal )
SELECT name, spins
FROM   sys.dm_os_spinlock_stats
WHERE  spins > 0;

DECLARE @Ticks bigint
SELECT @Ticks = cpu_ticks
FROM sys.dm_os_sys_info

WAITFOR DELAY '00:00:10'

DECLARE @TotalTicksInInterval BIGINT
DECLARE @CPU_GHz NUMERIC(20, 2);

SELECT @TotalTicksInInterval = (cpu_ticks - @Ticks) * @Sockets * @PhysicalCoresPerSocket,
       @CPU_GHz = ( cpu_ticks - @Ticks ) / 10000000000.0
FROM sys.dm_os_sys_info;

SELECT ISNULL(Snap.SpinLockName, 'Total') as [Spinlock Name],
       SUM(Stat.spins - Snap.SpinTotal) as [Spins In Interval],
       @TotalTicksInInterval as [Ticks In Interval],
       @CPU_Ghz as [Measured CPU GHz],
       100.0 * SUM(Stat.spins - Snap.SpinTotal) * @TicksPerSpin / @TotalTicksInInterval as [%]
FROM @SpinlockSnapshot Snap
JOIN sys.dm_os_spinlock_stats Stat
     ON Snap.SpinLockName = Stat.name
GROUP BY ROLLUP (Snap.SpinLockName)
HAVING SUM(Stat.spins - Snap.SpinTotal) > 0
ORDER BY [Spins In Interval] DESC;
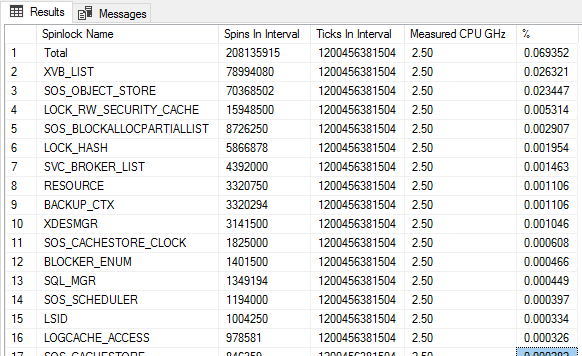
This is what I see on a very healthy server (r5.24xlarge). The server was using 14% cpu. And .03% of that is spent spinning (or somewhere in that ballpark).
More Troubleshooting Steps
So what’s going on? What is that XVB_LIST category? Microsoft says “internal use only” But I can guess. Paul Randal talks about the related latch class Versioning Transaction List. It’s an instance-wide list that is used in the implementation of features like Read Committed Snapshot Isolation (RCSI) which we do use.
Microsoft also has a whitepaper on troubleshooting this stuff Diagnose and resolve spinlock contention on SQL Server. They actually give a technique to collect call stacks during spinlock contention in order to try and maybe glean some information about what else is going on. We did that, but we didn’t learn too much. We learned that we use RCSI with lots of concurrent queries. Something we really can’t give up on.
So Then What?
What We Did
Well, we moved away from the u instance with its hundreds of CPUs and we went back to our r5 instance with only (only!) 96 logical CPUs. We’re dealing with the limits imposed by that hardware and accepting that we can’t scale higher using that box. We’re continuing to do our darnedest to move data and activity out of SQL Server and into other solutions like DynamoDb. We’re also trying to partition our databases into different deployments which spreads the load out, but introduces a lot of other challenges.
Basically, we gave up trying to scale higher. If we did want to pursue this further (which we don’t), we’d probably contact Microsoft support to try and address this spinlock contention. We know that these conditions are sufficient (if not necessary) to see the contention we saw:
SQL Server 2016 SP2
U-series instance from Amazon
Highly concurrent and frequent queries (>200K batch requests per second with a good mix of writes and reads on the same tables)
RCSI enabled.
Thank you Erin Stellato
We reached out to Erin Stellato to help us through this issue. We did this sometime around the “Painful Symptoms” section above. We had a stressful time troubleshooting all this stuff and I really appreciate Erin guiding us through it. We learned so much.
Last year, Aaron Bertrand tackled the question, How To Alter User Defined Table Types. Aaron points out that “There is no ALTER TYPE, and you can’t drop and re-create a type that is in use”. Aaron’s suggestion was to create a new type and then update all procedure to use the new type.
I think I’ve got a bit of improvement based on sp_rename and sp_refreshmodule. Something that works well with
imperfectly understood schemas, like schemas that may have suffered from a little bit of schema drift.
Example
Say I have… I don’t know, let’s pick an example out of thin air. Say I have a simple table type containing one BIGINT column that I want to make memory optimized:
What I’ve Got
CREATE TYPE dbo.BigIntSetASTABLE(ValueBIGINTNOTNULLINDEX IX_BigIntSet );
CREATE TYPE dbo.BigIntSet
  AS TABLE (
    Value BIGINT NOT NULL INDEX IX_BigIntSet );
What I Want
CREATE TYPE dbo.BigIntSetASTABLE(ValueBIGINTNOTNULLINDEX IX_BigIntSet )WITH(MEMORY_OPTIMIZED=ON);
CREATE TYPE dbo.BigIntSet
  AS TABLE (
    Value BIGINT NOT NULL INDEX IX_BigIntSet )
  WITH (MEMORY_OPTIMIZED=ON);
I can’t directly ALTER this table type, but I can do this three-card monte trick using sp_rename to put the BigIntSet in its place.
The Migration Script
IFNOTEXISTS(SELECT*FROM sys.table_typesWHERE name ='BigIntSet'AND is_memory_optimized =1)BEGINCREATE TYPE dbo.BigIntSet_MOASTABLE(ValuebigintNOTNULLINDEX IX_BigIntSet )WITH(MEMORY_OPTIMIZED=ON);
-- the switcheroo!EXECsp_rename'dbo.BigIntSet', 'zz_BigIntSet';
EXECsp_rename'dbo.BigIntSet_MO', 'BigIntSet';
--refresh modulesDECLARE @Refreshmodulescripts TABLE(script nvarchar(max));
INSERT @Refreshmodulescripts (script)SELECT'EXEC sp_refreshsqlmodule '''+QUOTENAME(referencing_schema_name)+'.'+QUOTENAME(referencing_entity_name)+''';'FROM sys.dm_sql_referencing_entities('dbo.BigIntSet', 'TYPE');
DECLARE @SQLNVARCHAR(MAX)= N'';
SELECT @SQL= @SQL+ script FROM @Refreshmodulescripts;
EXECsp_executesql @SQL;
END
IF NOT EXISTS (
  SELECT *
  FROM sys.table_types
  WHERE name = 'BigIntSet'
  AND is_memory_optimized = 1
)
BEGIN

  CREATE TYPE dbo.BigIntSet_MO
    AS TABLE (
      Value bigint NOT NULL
      INDEX IX_BigIntSet )
    WITH (MEMORY_OPTIMIZED=ON);

  -- the switcheroo!
  EXEC sp_rename 'dbo.BigIntSet', 'zz_BigIntSet';
  EXEC sp_rename 'dbo.BigIntSet_MO', 'BigIntSet';

  --refresh modules
  DECLARE @Refreshmodulescripts TABLE (script nvarchar(max));

  INSERT @Refreshmodulescripts (script)
  SELECT 'EXEC sp_refreshsqlmodule ''' + QUOTENAME(referencing_schema_name) + '.' + QUOTENAME(referencing_entity_name) + ''';'
  FROM sys.dm_sql_referencing_entities('dbo.BigIntSet', 'TYPE');

  DECLARE @SQL NVARCHAR(MAX) = N'';
  SELECT @SQL = @SQL + script FROM @Refreshmodulescripts;

  EXEC sp_executesql @SQL;

END
But Is This Online?
Mostly. All queries that are in progress (whether ad-hoc or via procedures), continue to execute with no issues. However, there may be an issue with other queries that begin their execution during this migration.
If someone sends a query that uses the table type in the split second between the two sp_rename statements, then the query may fail.
If someone executes a procedure in the time between the first sp_rename and when sp_executesql gets around to refreshing that procedure, then the procedure may fail.
In practice, even on a busy server, I saw no such errors the few times I’ve tried this method, but of course, that’s no guarantee. In my case, even when refreshing close to 300 modules, this script takes about one second with no issues.
I actually tried adding a transaction around this whole migration script, and I did in fact see issues on a busy server. The schema modification lock that needs to be taken and held on all 300 objects was too much. It caused excessive blocking and I had to abandon that approach. In practice, I avoided trouble by ditching the explicit transaction.
After identifying a database you’re curious about, you may want to drill down further. I wrote about this problem earlier in Tackle WRITELOG Waits Using the Transaction Log and Extended Events. The query I wrote for that post combines results of an extended events session with the transaction log in order to identify which procedures are doing the most writing.
But it’s a tricky kind of script. It takes a while to run on busy systems. There’s a faster way to drill into writes if you switch your focus from which queries are writing so much to which tables are being written to so much. Both methods of drilling down can be helpful, but the table approach is faster and doesn’t require an extended event session and it might be enough to point you in the right direction.
Use This Query
use[specify your databasename here]-- get the latest lsn for current DBdeclare @xact_seqno binary(10);
declare @xact_seqno_string_begin varchar(50);
exec sp_replincrementlsn @xact_seqno OUTPUT;
set @xact_seqno_string_begin ='0x'+CONVERT(varchar(50), @xact_seqno, 2);
set @xact_seqno_string_begin =stuff(@xact_seqno_string_begin, 11, 0, ':')set @xact_seqno_string_begin =stuff(@xact_seqno_string_begin, 20, 0, ':');
-- wait a few secondswaitfor delay '00:00:10'-- get the latest lsn for current DBdeclare @xact_seqno_string_end varchar(50);
exec sp_replincrementlsn @xact_seqno OUTPUT;
set @xact_seqno_string_end ='0x'+CONVERT(varchar(50), @xact_seqno, 2);
set @xact_seqno_string_end =stuff(@xact_seqno_string_end, 11, 0, ':')set @xact_seqno_string_end =stuff(@xact_seqno_string_end, 20, 0, ':');
WITH[Log]AS(SELECT Category,
SUM([Log Record Length])as[Log Bytes]FROM fn_dblog(@xact_seqno_string_begin, @xact_seqno_string_end)CROSS APPLY (SELECT ISNULL(AllocUnitName, Operation))AS C(Category)GROUPBY Category
)SELECT Category,
[Log Bytes],
100.0*[Log Bytes]/SUM([Log Bytes])OVER()AS[%]FROM[Log]ORDERBY[Log Bytes]DESC;
use [specify your databasename here]

-- get the latest lsn for current DB
declare @xact_seqno binary(10);
declare @xact_seqno_string_begin varchar(50);
exec sp_replincrementlsn @xact_seqno OUTPUT;
set @xact_seqno_string_begin = '0x' + CONVERT(varchar(50), @xact_seqno, 2);
set @xact_seqno_string_begin = stuff(@xact_seqno_string_begin, 11, 0, ':')
set @xact_seqno_string_begin = stuff(@xact_seqno_string_begin, 20, 0, ':');

-- wait a few seconds
waitfor delay '00:00:10'

-- get the latest lsn for current DB
declare @xact_seqno_string_end varchar(50);
exec sp_replincrementlsn @xact_seqno OUTPUT;
set @xact_seqno_string_end = '0x' + CONVERT(varchar(50), @xact_seqno, 2);
set @xact_seqno_string_end = stuff(@xact_seqno_string_end, 11, 0, ':')
set @xact_seqno_string_end = stuff(@xact_seqno_string_end, 20, 0, ':');

WITH [Log] AS
(
  SELECT Category,
         SUM([Log Record Length]) as [Log Bytes]
  FROM   fn_dblog(@xact_seqno_string_begin, @xact_seqno_string_end)
  CROSS  APPLY (SELECT ISNULL(AllocUnitName, Operation)) AS C(Category)
  GROUP  BY Category
)
SELECT   Category,
         [Log Bytes],
         100.0 * [Log Bytes] / SUM([Log Bytes]) OVER () AS [%]
FROM     [Log]
ORDER BY [Log Bytes] DESC;
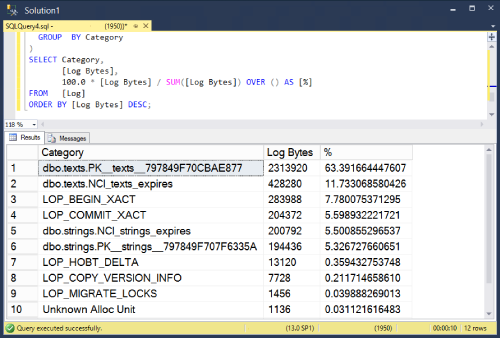
Results look something like this (Your mileage may vary).
Notes
Notice that some space in the transaction log is not actually about writing to tables. I’ve grouped them into their own categories and kept them in the results. For example LOP_BEGIN_XACT records information about the beginning of transactions.
I’m using sp_replincrementlsn to find the current last lsn. I could have used log_min_lsn from sys.dm_db_log_stats but that dmv is only available in 2016 SP2 and later.
This method is a little more direct measurement of transaction log activity than a similar query that uses sys.dm_db_index_operational_stats
Taking a small break from my blogging sabbatical to post one script that I’ve found myself writing from scratch too often.
My hope is that the next time I need this, I’ll look it up here.
The User Settable Counter
Use this to monitor something that’s not already exposed as a performance counter. Like the progress of a custom task or whatever. If you can write a quick query, you can expose it to a counter that can be plotted by Performance Monitor.
Here’s the script (adjust SomeMeasurement and SomeTable to whatever makes sense and adjust the delay interval if 1 second is too short:
declare @deltaMeasurement int = 0;
declare @totalMeasurement int = 0;

while (1=1)
begin

  select @deltaMeasurement = SomeMeasurement - @totalMeasurement
  from SomeTable;

  set @totalMeasurement += @deltaMeasurement;

  exec sp_user_counter1 @deltaMeasurement;
  waitfor delay '00:00:01'
end
Monitoring
Now you can monitor “User Counter 1” in the object “SQLServer:User Settable” which will look like this:
Don’t forget to stop the running query when you’re done.
A couple weeks ago, I wrote about how to find lonely tables in Sql Server. This is a follow up to that post. I’m now going to talk about small sets of tables that are joined to eachother, but no-one else.
It’s Not Just Me
It seems everyone’s talking about this.
So as I was writing this post and code I noticed an amazing coincidence. I saw the same ideas I was writing about being discussed on twitter by Kelly Sommers, Ben Johnson and others.
They discuss Uber’s microservice graph. When visualized, it’s a big mish-mash of dependencies. Kelly points out how hard it is to reason about and Ben points to a small decoupled piece of the system that he wants to work on.
Me too Ben! And I think that’s the value of that visualization. It can demonstrate to others how tangled your system is. It can also identify small components that are not connected to the main mess. When I tie it to my last post and consider this idea in the database world, I can expand my idea of lonely tables to small sets of tables that are never joined to other tables.
I want to find them because these tables are also good candidates for extraction but how do I find them? I start by visualizing tables and their joins.
Visualizing Table Joins
I started by looking for existing visualizations. I didn’t find exactly what I wanted so I coded my own visualization (with the help of the d3 library). It’s always fun to code your own physics engine.
Here’s what I found
A monolith with some smaller isolated satellites
An example that might be good to extract
That ball of mush in the middle is hard to look at, but the smaller disconnected bits aren’t! Just like Ben, I want to work on those smaller pieces too! And just like the lonely tables we looked at last week, these small isolated components are also good candidates for extracting from SQL Server.
There’s a query at the end of this post. When you run it, you’ll get pairs of table names and when you paste it into the Show Graph page, you’ll see a visualization of your database.
(This is all client-side code, I don’t collect any data).
The Query
use[your database name goes here];
select
qs.query_hash,
qs.plan_handle,
cast(nullas xml)as query_plan
into #myplans
from sys.dm_exec_query_stats qs
cross apply sys.dm_exec_plan_attributes(qs.plan_handle) pa
where pa.attribute='dbid'and pa.value=db_id();
with duplicate_queries as(select ROW_NUMBER()over(partition by query_hash orderby(select1)) r
from #myplans
)delete duplicate_queries
where r >1;
update #myplans
set query_plan = qp.query_planfrom #myplans mp
cross apply sys.dm_exec_query_plan(mp.plan_handle) qp
;WITH XMLNAMESPACES (DEFAULT'http://schemas.microsoft.com/sqlserver/2004/07/showplan'),
mycte as(select q.query_hash,
obj.value('(@Schema)[1]', 'sysname')AS schema_name,
obj.value('(@Table)[1]', 'sysname')AS table_name
from #myplans q
cross apply q.query_plan.nodes('/ShowPlanXML/BatchSequence/Batch/Statements/StmtSimple')as nodes(stmt)CROSS APPLY stmt.nodes('.//IndexScan/Object')AS index_object(obj))select query_hash, schema_name, table_name
into #myExecutions
from mycte
where schema_name isnotnullandobject_id(schema_name +'.'+ table_name)in(selectobject_idfrom sys.tables)groupby query_hash, schema_name, table_name;
selectDISTINCT A.table_nameas first_table,
B.table_nameas second_table
from #myExecutions A
join #myExecutions B
on A.query_hash= B.query_hashwhere A.table_name< B.table_name;
use [your database name goes here];

select
    qs.query_hash,
    qs.plan_handle,
    cast(null as xml) as query_plan
into #myplans
from sys.dm_exec_query_stats qs
cross apply sys.dm_exec_plan_attributes(qs.plan_handle) pa
where pa.attribute = 'dbid'
and pa.value = db_id();

with duplicate_queries as
(
    select ROW_NUMBER() over (partition by query_hash order by (select 1)) r
    from #myplans
)
delete duplicate_queries
where r > 1;

update #myplans
set query_plan = qp.query_plan
from #myplans mp
cross apply sys.dm_exec_query_plan(mp.plan_handle) qp

;WITH XMLNAMESPACES (DEFAULT 'http://schemas.microsoft.com/sqlserver/2004/07/showplan'),
mycte as
(
    select q.query_hash,
           obj.value('(@Schema)[1]', 'sysname') AS schema_name,
           obj.value('(@Table)[1]', 'sysname') AS table_name
    from #myplans q
    cross apply q.query_plan.nodes('/ShowPlanXML/BatchSequence/Batch/Statements/StmtSimple') as nodes(stmt)
    CROSS APPLY stmt.nodes('.//IndexScan/Object') AS index_object(obj)
)
select query_hash, schema_name, table_name
into #myExecutions
from mycte
where schema_name is not null
and object_id(schema_name + '.' + table_name) in (select object_id from sys.tables)
group by query_hash, schema_name, table_name;

select DISTINCT A.table_name as first_table,
       B.table_name as second_table
from #myExecutions A
join #myExecutions B
on A.query_hash = B.query_hash
where A.table_name < B.table_name;
Takeaway: I provide a script that looks at the procedure cache and reports tables that are never joined to other tables.
Recently, I’ve been working hard to reduce our use of SQL Server as much as possible. In other words, I’ve been doing some spring cleaning. I pick up a table in my hands and I look at it. If it doesn’t spark joy then I drop it.
If only it were that easy. That’s not quite the process I’m using. The specific goals I’m chasing are about reducing cost. I’m moving data to cheaper data stores when it makes sense.
So let’s get tidying. But where do I start?
Getting rid of SQL Server tables should accomplish a couple things. First, it should “move the needle”. If my goal is cost, then the tables I choose to remove should reduce my hardware or licensing costs in a tangible way. The second thing is that dropping the table is achievable without 10 years of effort. So I want to focus on “achievability” for a bit.
Achievable
What’s achievable? I want to identify tables to extract from the database that won’t take years. Large monolithic systems can have a lot of dependencies to unravel.
So what tables in the database have the least dependencies? How do I tell without a trustworthy data model? Is it the ones with the fewest foreign keys (in or out)? Maybe, but foreign keys aren’t always defined properly or they can be missing all together.
My thought is that if two tables are joined together in some query, then they’re related or connected in some fashion. So that’s my idea. I can look at the procedure cache of a database in production to see where the connections are. And when I know that, I can figure out what tables are not connected.
Lonely Tables
This script gives me set of tables that aren’t joined to any other table in any query in cache
use[your db name here];
SELECT qs.query_hash,
qs.plan_handle,
cast(nullas xml)as query_plan
INTO #myplans
FROM sys.dm_exec_query_stats qs
CROSS APPLY sys.dm_exec_plan_attributes(qs.plan_handle) pa
WHERE pa.attribute='dbid'AND pa.value=db_id();
WITH duplicate_queries AS(SELECT ROW_NUMBER()OVER(PARTITION BY query_hash ORDERBY(SELECT1)) n
FROM #myplans
)DELETE duplicate_queries
WHERE n >1;
UPDATE #myplans
SET query_plan = qp.query_planFROM #myplans mp
CROSS APPLY sys.dm_exec_query_plan(mp.plan_handle) qp;
WITH XMLNAMESPACES (DEFAULT'http://schemas.microsoft.com/sqlserver/2004/07/showplan'),
my_cte AS(SELECT q.query_hash,
obj.value('(@Schema)[1]', 'sysname')AS[schema_name],
obj.value('(@Table)[1]', 'sysname')AS table_name
FROM #myplans q
CROSS APPLY q.query_plan.nodes('/ShowPlanXML/BatchSequence/Batch/Statements/StmtSimple')as nodes(stmt)CROSS APPLY stmt.nodes('.//IndexScan/Object')AS index_object(obj))SELECT query_hash, [schema_name], table_name
INTO #myExecutions
FROM my_cte
WHERE[schema_name]ISNOTNULLANDOBJECT_ID([schema_name]+'.'+ table_name)IN(SELECTobject_idFROM sys.tables)GROUPBY query_hash, [schema_name], table_name;
WITH multi_table_queries AS(SELECT query_hash
FROM #myExecutions
GROUPBY query_hash
HAVINGCOUNT(*)>1),
lonely_tables as(SELECT[schema_name], table_name
FROM #myExecutions
EXCEPTSELECT[schema_name], table_name
FROM #myexecutions WHERE query_hash IN(SELECT query_hash FROM multi_table_queries))SELECT l.*, ps.row_countFROM lonely_tables l
JOIN sys.dm_db_partition_stats ps
ONOBJECT_ID(l.[schema_name]+'.'+ l.table_name)= ps.object_idWHERE ps.index_idin(0,1)ORDERBY ps.row_countDESC;
use [your db name here];

SELECT qs.query_hash,
       qs.plan_handle,
       cast(null as xml) as query_plan
  INTO #myplans
  FROM sys.dm_exec_query_stats qs
 CROSS APPLY sys.dm_exec_plan_attributes(qs.plan_handle) pa
 WHERE pa.attribute = 'dbid'
   AND pa.value = db_id();

WITH duplicate_queries AS
(
  SELECT ROW_NUMBER() OVER (PARTITION BY query_hash ORDER BY (SELECT 1)) n
  FROM #myplans
)
DELETE duplicate_queries
 WHERE n > 1;

UPDATE #myplans
   SET query_plan = qp.query_plan
  FROM #myplans mp
 CROSS APPLY sys.dm_exec_query_plan(mp.plan_handle) qp;

WITH XMLNAMESPACES (DEFAULT 'http://schemas.microsoft.com/sqlserver/2004/07/showplan'),
my_cte AS
(
    SELECT q.query_hash,
           obj.value('(@Schema)[1]', 'sysname') AS [schema_name],
           obj.value('(@Table)[1]', 'sysname') AS table_name
      FROM #myplans q
     CROSS APPLY q.query_plan.nodes('/ShowPlanXML/BatchSequence/Batch/Statements/StmtSimple') as nodes(stmt)
     CROSS APPLY stmt.nodes('.//IndexScan/Object') AS index_object(obj)
)
SELECT query_hash, [schema_name], table_name
  INTO #myExecutions
  FROM my_cte
 WHERE [schema_name] IS NOT NULL
   AND OBJECT_ID([schema_name] + '.' + table_name) IN (SELECT object_id FROM sys.tables)
 GROUP BY query_hash, [schema_name], table_name;

WITH multi_table_queries AS
(
    SELECT query_hash
      FROM #myExecutions
     GROUP BY query_hash
    HAVING COUNT(*) > 1
),
lonely_tables as
(
    SELECT [schema_name], table_name
      FROM #myExecutions
    EXCEPT
    SELECT [schema_name], table_name
      FROM #myexecutions WHERE query_hash IN (SELECT query_hash FROM multi_table_queries)
)
SELECT l.*, ps.row_count
  FROM lonely_tables l
  JOIN sys.dm_db_partition_stats ps
       ON OBJECT_ID(l.[schema_name] + '.' + l.table_name) = ps.object_id
 WHERE ps.index_id in (0,1)
 ORDER BY ps.row_count DESC;
Caveats
So many caveats.
There are so many things that take away from the accuracy and utility of this script that I hesitated to even publish it.
Here’s the way I used the script. The list of tables was something that helped me begin an investigation. For me, I didn’t use it to give answers, but to generate questions. For example, taking each table in the list, I asked: “How hard would it be to get rid of table X and what would that save us?” I found it useful to consider those questions. Your mileage of course will vary.
The other day, Erin Stellato asked a question on twitter about the value of nested SPs. Here’s how I weighed in:
I’m not a fan of nested anything. Too much hidden complexity. Code reusability leads to queries that are jack of all trades, master of none. “Don’t repeat yourself” doesn’t work as well in SQL as it does in other code.
Hidden complexity has given me many problems in the past. SQL Server really really likes things simple and so it’s nice to be able to uncover that complexity. Andy Yun has tackled this problem for nested views with his sp_helpexpandview.
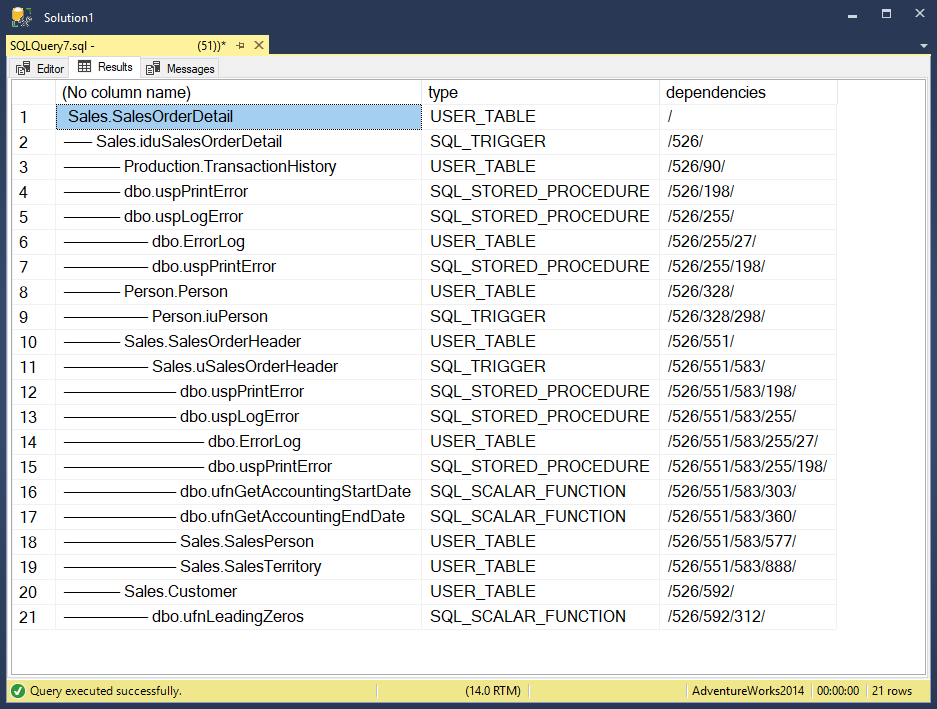
Here’s what I came up with for nested anything. It helps unravel a tree of dependencies based on information found in sys.triggers and sys.dm_sql_referenced_entities. With it, you can see what’s involved when interacting with objects. Here’s what things look like for Sales.SalesOrderDetail in AdventureWorks2014. A lot of the resulting rows can be ignored, but there can be surprises in there too.
DECLARE @object_name SYSNAME ='Sales.SalesOrderDetail';
WITH dependencies AS(SELECT @object_nameAS[object_name],
CAST(QUOTENAME(OBJECT_SCHEMA_NAME(OBJECT_ID(@object_name)))+'.'+QUOTENAME(OBJECT_NAME(OBJECT_ID(@object_name)))as sysname)as[escaped_name],
[type_desc],
object_id(@object_name)AS[object_id],
1AS is_updated,
CAST('/'+CAST(object_id(@object_name)%10000asVARCHAR(30))+'/'AS hierarchyid)as tree,
0as trigger_parent_id
FROM sys.objectsWHEREobject_id=object_id(@object_name)UNIONALLSELECTCAST(OBJECT_SCHEMA_NAME(o.[object_id])+'.'+OBJECT_NAME(o.[object_id])as sysname),
CAST(QUOTENAME(OBJECT_SCHEMA_NAME(o.[object_id]))+'.'+QUOTENAME(OBJECT_NAME(o.[object_id]))as sysname),
o.[type_desc],
o.[object_id],
CASE o.[type]when'U'then re.is_updatedelse1end,
CAST(d.tree.ToString()+CAST(o.[object_id]%10000asVARCHAR(30))+'/'AS hierarchyid),
0as trigger_parent_id
FROM dependencies d
CROSS APPLY sys.dm_sql_referenced_entities(d.[escaped_name], default) re
JOIN sys.objects o
ON o.object_id= isnull(re.referenced_id, object_id(ISNULL(re.referenced_schema_name,'dbo')+'.'+ re.referenced_entity_name))WHERE tree.GetLevel()<10AND re.referenced_minor_id=0AND o.[object_id]<> d.trigger_parent_idANDCAST(d.tree.ToString()asvarchar(1000))notlike'%'+CAST(o.[object_id]%10000asvarchar(1000))+'%'UNIONALLSELECTCAST(OBJECT_SCHEMA_NAME(t.[object_id])+'.'+OBJECT_NAME(t.[object_id])as sysname),
CAST(QUOTENAME(OBJECT_SCHEMA_NAME(t.[object_id]))+'.'+QUOTENAME(OBJECT_NAME(t.[object_id]))as sysname),
'SQL_TRIGGER',
t.[object_id],
0AS is_updated,
CAST(d.tree.ToString()+CAST(t.object_id%10000asVARCHAR(30))+'/'AS hierarchyid),
t.parent_idas trigger_parent_id
FROM dependencies d
JOIN sys.triggers t
ON d.[object_id]= t.parent_idWHERE d.is_updated=1AND tree.GetLevel()<10ANDCAST(d.tree.ToString()asvarchar(1000))notlike'%'+cast(t.[object_id]%10000asvarchar(1000))+'%')SELECTreplicate('—', tree.GetLevel()-1)+' '+[object_name],
[type_desc]as[type],
tree.ToString()as dependencies
FROM dependencies
ORDERBY tree
DECLARE @object_name SYSNAME = 'Sales.SalesOrderDetail';

WITH dependencies AS
(
    SELECT @object_name AS [object_name],
           CAST(
             QUOTENAME(OBJECT_SCHEMA_NAME(OBJECT_ID(@object_name))) + '.' +
             QUOTENAME(OBJECT_NAME(OBJECT_ID(@object_name)))
             as sysname) as [escaped_name],
           [type_desc],
           object_id(@object_name) AS [object_id],
           1 AS is_updated,
           CAST('/' + CAST(object_id(@object_name) % 10000 as VARCHAR(30)) + '/' AS hierarchyid) as tree,
           0 as trigger_parent_id
      FROM sys.objects
     WHERE object_id = object_id(@object_name)

    UNION ALL

    SELECT CAST(OBJECT_SCHEMA_NAME(o.[object_id]) + '.' + OBJECT_NAME(o.[object_id]) as sysname),
           CAST(QUOTENAME(OBJECT_SCHEMA_NAME(o.[object_id])) + '.' + QUOTENAME(OBJECT_NAME(o.[object_id])) as sysname),
           o.[type_desc],
           o.[object_id],
           CASE o.[type] when 'U' then re.is_updated else 1 end,
           CAST(d.tree.ToString() + CAST(o.[object_id] % 10000 as VARCHAR(30)) + '/' AS hierarchyid),
           0 as trigger_parent_id
      FROM dependencies d
     CROSS APPLY sys.dm_sql_referenced_entities(d.[escaped_name], default) re
      JOIN sys.objects o
           ON o.object_id = isnull(re.referenced_id, object_id(ISNULL(re.referenced_schema_name,'dbo') + '.' + re.referenced_entity_name))
     WHERE tree.GetLevel() < 10
       AND re.referenced_minor_id = 0
       AND o.[object_id] <> d.trigger_parent_id
       AND CAST(d.tree.ToString() as varchar(1000)) not like '%' + CAST(o.[object_id] % 10000 as varchar(1000)) + '%'

     UNION ALL

     SELECT CAST(OBJECT_SCHEMA_NAME(t.[object_id]) + '.' + OBJECT_NAME(t.[object_id]) as sysname),
            CAST(QUOTENAME(OBJECT_SCHEMA_NAME(t.[object_id])) + '.' + QUOTENAME(OBJECT_NAME(t.[object_id])) as sysname),
            'SQL_TRIGGER',
            t.[object_id],
            0 AS is_updated,
            CAST(d.tree.ToString() + CAST(t.object_id % 10000 as VARCHAR(30)) + '/' AS hierarchyid),
            t.parent_id as trigger_parent_id
       FROM dependencies d
       JOIN sys.triggers t
            ON d.[object_id] = t.parent_id
      WHERE d.is_updated = 1
        AND tree.GetLevel() < 10
        AND CAST(d.tree.ToString() as varchar(1000)) not like '%' + cast(t.[object_id] % 10000 as varchar(1000)) + '%'
)
SELECT replicate('—', tree.GetLevel() - 1) + ' ' + [object_name],
       [type_desc] as [type],
       tree.ToString() as dependencies
  FROM dependencies
 ORDER BY tree
Names for constraints are optional meaning that if you don’t provide a name when it’s created or cannot afford one, one will be appointed to you by the system.
These system provided names are messy things and I don’t think I have to discourage you from using them. Kenneth Fisher has already done that in Constraint names, Say NO to the default.
SELECT SCHEMA_NAME(schema_id) AS [schema name],
       OBJECT_NAME(object_id) AS [system generated object name],
       OBJECT_NAME(parent_object_id) AS [parent object name],
       type_desc AS [object type]
  FROM sys.objects
 WHERE OBJECT_NAME(object_id) LIKE
         type + '\_\_' + LEFT(OBJECT_NAME(parent_object_id),8) + '\_\_%' ESCAPE '\'
       OR
       OBJECT_NAME(object_id) LIKE
          REPLACE(sys.fn_varbintohexstr(CAST(object_id AS VARBINARY(MAX))), '0x', '%\_\_') ESCAPE '\'
This will find all your messy system-named constraints.
For example, a table defined like this:
SELECT OBJECT_SCHEMA_NAME(id) AS [schema name],
       OBJECT_NAME(constid) AS [system generated constraint name],
       (select type_desc from sys.objects where object_id = constid) as [constraint type],
       OBJECT_NAME(id) AS [parent object name],
       (select type_desc from sys.objects where object_id = id) as [parent object type]
  FROM sys.sysconstraints
 WHERE status & 0x20000 > 0
   AND OBJECT_NAME(id) NOT IN (N'__RefactorLog', N'sysdiagrams')
 ORDER BY [parent object type], [parent object name], [system generated constraint name];
“Above all else, show the data” says Edwarde Tufte. He’s the data visualization expert who promotes a high data-ink ratio in data visualizations. He describes data-ink as “the non-erasable core of a graphic”. In other words, avoid chartjunk.
SQL Junk
I buy that. Less is More. And we can apply that idea to SQL. If SQL is going to be maintained by a human, it’s best to use a style that is easy on the reader. There’s a lot of syntax in SQL that is redundant. By keeping only the non-erasable syntax in SQL statements, the SQL gets easier to understand and maintain.
Square Brackets
I know I’m not the only one who thinks so. I was watching Kendra Little’s presentation SSMS Shortcuts & Secrets. When someone asked whether there was a shortcut for removing brackets. There isn’t. Most people search and replace “[” with “” and then do the same thing with “]”. Kendra wondered if there was a regular expression that allowed a user to do both. There is, but it’s awkward because brackets need to be escaped: [\[\]] (which is only slightly easier to remember than ¯\_(ツ)_/¯).
SQL Junk in SSMS Generated Scripts
SSMS’s scripting engine is great at taking an object like a table and giving you a CREATE statement that will perfectly recreate what you need. But it’s a huge contributor of SQL Junk. I’ve seen so much SSMS-generated SQL get checked in to repositories that the style is assumed to be a best practice.
Here’s something that shows just how much SQL Junk can be removed. I think the resulting SQL is so much more clear and so much easier to maintain.