If you define a clustered index that’s not unique, SQL Server will add a hidden 4-byte column called UNIQUIFIER. You can’t see it directly but it’s there. When you add a row whose key is a duplicate of an existing row, the new row gets a new unique value for it’s uniqueifier. If you add over 2.1 billion rows with the same key, the uniquifier value exceeds the limit and you will see error 666.
A while ago, we nearly got into trouble because of a bad choice for clustering key that went undetected for so long.
Is your database nearing trouble?
Here’s a script that might help you find out.
selecttop100OBJECT_SCHEMA_NAME(t.object_id)as[schema],
t.nameas[table],
i.nameas[index],
i.type_desc,
i.is_unique,
s.range_high_key,
s.equal_rowsfromsys.indexes i
innerjoinsys.tables t
on i.object_id= t.object_idcrossapplysys.dm_db_stats_histogram(i.object_id, i.index_id) s
leftjoinsys.index_columns ic
on ic.object_id= i.object_idand ic.index_id= i.index_idand ic.index_column_id=2where
i.index_id=1and i.is_unique=0and ic.index_idisnullorderby s.equal_rowsdesc
select top 100
  OBJECT_SCHEMA_NAME(t.object_id) as [schema],
  t.name as [table],
  i.name as [index],
  i.type_desc,
  i.is_unique,
  s.range_high_key,
  s.equal_rows
from
  sys.indexes i
inner join
  sys.tables t
  on i.object_id = t.object_id
cross apply
  sys.dm_db_stats_histogram(i.object_id, i.index_id) s
left join
  sys.index_columns ic
  on ic.object_id = i.object_id
  and ic.index_id = i.index_id
  and ic.index_column_id = 2
where
  i.index_id = 1
  and i.is_unique = 0
  and ic.index_id is null
order by s.equal_rows desc
This query looks at clustered indexes that are not unique. It looks through the stats histogram and reports any with a high “EQUAL” range count.
If any of the equal_rows values are nearing 2 billion, then look out.
Kimberly Tripp always advocated uniqueness as a property of a good clustering index. That implies that equal_rows in the results here should be closer to 1 – nowhere near 2 billion!. So Microsoft’s advice holds true: “review tables that rely on uniqueifiers and proactively work to improve its design”.
If you find instances where any of the equal_rows are above 10000, you might choose to look closer.
Update: A careful look at the script will tell you that I’m excluding clustered indexes with more than one key column from the results. It’s still possible to get into trouble with multi-column clustered indexes, but because the stats histogram only focuses on the first column, this script can’t (easily) warn you about those times. See the comment section for lots more discussion.
When I deploy database changes, I like my scripts to be quick, non-blocking, rerunnable and resumable. I’ve discovered that:
Turning on Resource Governor is quick and online
Turning off Resource Governor is quick and online
Cleaning or removing configuration is easy
Modifying configuration may take some care
Turning on Resource Governor
Just like sp_configure, Resource Governor is configured in two steps. The first step is to specify the configuration you want, the second step is to ALTER RESOURCE GOVERNOR RECONFIGURE.
But unlike sp_configure which has a “config_value” column and a “run_value” column, there’s no single view that makes it easy to determine what values are configured, and what values are in use. It turns out that the catalog views are the configured values and the dynamic management views are the current values in use:
Catalog Views (configuration)
sys.resource_governor_configuration
sys.resource_governor_external_resource_pools
sys.resource_governor_resource_pools
sys.resource_governor_workload_groups
Dynamic Management Views (running values and stats)
sys.dm_resource_governor_configuration
sys.dm_resource_governor_external_resource_pools
sys.dm_resource_governor_resource_pools
sys.dm_resource_governor_workload_groups
When a reconfigure is pending, these views can contain different information and getting them straight is the key to writing rerunnable deployment scripts.
use master;
IFNOTEXISTS(SELECT*FROM sys.resource_governor_resource_poolsWHERE name ='SSMSPool')BEGINCREATE RESOURCE POOL SSMSPool;
ENDIFNOTEXISTS(SELECT*FROM sys.resource_governor_workload_groupsWHERE name ='SSMSGroup')BEGINCREATE WORKLOAD GROUP SSMSGroup
WITH(MAX_DOP =1)USING SSMSPool;
ENDIF(OBJECT_ID('dbo.resource_governor_classifier')ISNULL)BEGINDECLARE @SQLNVARCHAR(1000)= N'
CREATE FUNCTION dbo.resource_governor_classifier()
RETURNS sysname
WITH SCHEMABINDING
AS
BEGIN
RETURN
CASE APP_NAME()
WHEN ''Microsoft SQL Server Management Studio - Query'' THEN ''SSMSGroup''
ELSE ''default''
END;
END';
execsp_executesql @SQL;
END;
IFNOTEXISTS(SELECT*FROM sys.resource_governor_configuration/* config */WHERE classifier_function_id =OBJECT_ID('dbo.resource_governor_classifier'))ANDOBJECT_ID('dbo.resource_governor_classifier')ISNOTNULLBEGINALTER RESOURCE GOVERNOR WITH(CLASSIFIER_FUNCTION = dbo.resource_governor_classifier);
END
use master;

IF NOT EXISTS (
	SELECT *
	FROM sys.resource_governor_resource_pools
	WHERE name = 'SSMSPool'
)
BEGIN
	CREATE RESOURCE POOL SSMSPool;
END

IF NOT EXISTS (
	SELECT *
	FROM sys.resource_governor_workload_groups
	WHERE name = 'SSMSGroup'
)
BEGIN
	CREATE WORKLOAD GROUP SSMSGroup
	WITH (MAX_DOP = 1)
	USING SSMSPool;
END

IF ( OBJECT_ID('dbo.resource_governor_classifier') IS NULL )
BEGIN
	DECLARE @SQL NVARCHAR(1000) = N'
CREATE FUNCTION dbo.resource_governor_classifier()
	RETURNS sysname
	WITH SCHEMABINDING
AS
BEGIN

	RETURN
		CASE APP_NAME()
			WHEN ''Microsoft SQL Server Management Studio - Query'' THEN ''SSMSGroup''
			ELSE ''default''
		END;
END';
	exec sp_executesql @SQL;
END;

IF NOT EXISTS (
	SELECT *
	FROM sys.resource_governor_configuration /* config */
	WHERE classifier_function_id = OBJECT_ID('dbo.resource_governor_classifier') )
   AND OBJECT_ID('dbo.resource_governor_classifier') IS NOT NULL
BEGIN
	ALTER RESOURCE GOVERNOR WITH (CLASSIFIER_FUNCTION = dbo.resource_governor_classifier);
END
IFEXISTS(SELECT*FROM sys.dm_resource_governor_configurationWHERE is_reconfiguration_pending =1)OREXISTS(SELECT*FROM sys.resource_governor_configurationWHERE is_enabled =0)BEGINALTER RESOURCE GOVERNOR RECONFIGURE;
END
GO
IF EXISTS (
	SELECT *
	FROM sys.dm_resource_governor_configuration
	WHERE is_reconfiguration_pending = 1
) OR EXISTS (
	SELECT *
	FROM sys.resource_governor_configuration
	WHERE is_enabled = 0
)
BEGIN
	ALTER RESOURCE GOVERNOR RECONFIGURE;
END
GO
Turning off Resource Governor
Pretty straightforward, the emergency stop button looks like this:
ALTER RESOURCE GOVERNOR DISABLE;
ALTER RESOURCE GOVERNOR DISABLE;
If you ever find yourself in big trouble (because you messed up the classifier function for example), use the Dedicated Admin Connection (DAC) to disable Resource Governor. The DAC uses the internal workload group regardless of how Resource Governor is configured.
After you’ve disabled Resource Governor, you may notice that the resource pools and workload groups are still sitting there. The configuration hasn’t been cleaned up or anything.
Cleaning Up
Cleaning up doesn’t start out too bad, deal with the classifier function, then drop the groups and pools:
ALTER RESOURCE GOVERNOR DISABLE
ALTER RESOURCE GOVERNOR WITH(CLASSIFIER_FUNCTION =NULL);
DROPFUNCTIONIFEXISTS dbo.resource_governor_classifier;
IFEXISTS(SELECT*FROM sys.resource_governor_workload_groupsWHERE name ='SSMSGroup')BEGINDROP WORKLOAD GROUP SSMSGroup;
ENDIFEXISTS(SELECT*FROM sys.resource_governor_resource_poolsWHERE name ='SSMSPool')BEGINDROP RESOURCE POOL SSMSPool;
END
ALTER RESOURCE GOVERNOR DISABLE
ALTER RESOURCE GOVERNOR WITH (CLASSIFIER_FUNCTION = NULL);
DROP FUNCTION IF EXISTS dbo.resource_governor_classifier;

IF EXISTS (
	SELECT *
	FROM sys.resource_governor_workload_groups
	WHERE name = 'SSMSGroup'
)
BEGIN
	DROP WORKLOAD GROUP SSMSGroup;
END

IF EXISTS (
	SELECT *
	FROM sys.resource_governor_resource_pools
	WHERE name = 'SSMSPool'
)
BEGIN
	DROP RESOURCE POOL SSMSPool;
END
You’ll be left in a state where is_reconfiguration_pending = 1 but since Resource Governor is disabled, it doesn’t really matter.
Modifying Resource Governor configuration
This is kind of a tricky thing and everyone’s situation is different. My advice would be to follow this kind of strategy:
Determine if the configuration is correct, if not:
Turn off Resource Governor
Clean up
Configure correctly (plot a course)
Turn on (make it so)
Somewhere along the way, if you delete a workload group that some session is still using, then ALTER RESOURCE GOVERNOR RECONFIGURE may give this error message:
Msg 10904, Level 16, State 2, Line 105
Resource governor configuration failed. There are active sessions in workload groups being dropped or moved to different resource pools.
Disconnect all active sessions in the affected workload groups and try again.
You have to wait for those sessions to end (or kill them) before trying again. But which sessions? These ones:
SELECT
dwg.name[currentworkgroup],
dwg.pool_id[current resource pool],
wg.name[configured workgroup],
wg.pool_id[configured resource pool],
s.*FROM
sys.dm_exec_sessions s
INNERJOIN
sys.dm_resource_governor_workload_groups dwg /* existing groups */ON dwg.group_id= s.group_idLEFTJOIN
sys.resource_governor_workload_groups wg /* configured groups */ON wg.group_id= s.group_idWHERE
isnull(wg.group_id, -1)<> dwg.pool_idORDERBY
s.session_id;
SELECT
	dwg.name [current work group],
	dwg.pool_id [current resource pool],
	wg.name [configured work group],
	wg.pool_id [configured resource pool],
	s.*
FROM
	sys.dm_exec_sessions s
INNER JOIN
	sys.dm_resource_governor_workload_groups dwg /* existing groups */
	ON dwg.group_id = s.group_id
LEFT JOIN
	sys.resource_governor_workload_groups wg /* configured groups */
	ON wg.group_id = s.group_id
WHERE
	isnull(wg.group_id, -1) <> dwg.pool_id
ORDER BY
	s.session_id;
If you find your own session in that list, reconnect.
Once that list is empty feel free to try again.
In the past I’ve written about monitoring identity columns to ensure there’s room to grow.
But there’s a related danger that’s a little more subtle. Say you have a table whose identity column is an 8-byte bigint. An application that converts those values to a 4-byte integer will not always fail! Those applications will only fail if the value is larger than 2,147,483,647.
If the conversion of a large value is done in C#, you’ll get an Overflow Exception or an Invalid Cast Exception and if the conversion is done in SQL Server you’ll see get this error message:
Msg 8115, Level 16, State 2, Line 21
Arithmetic overflow error converting expression to data type int.
The danger
If such conversions exist in your application, you won’t see any problems until the bigint identity values are larger than 2,147,483,647. My advice then is to test your application with large identity values in a test environment. But how?
Use this script to set large values on BIGINT identity columns
On a test server, run this script to get commands to adjust bigint identity values to beyond the maximum value of an integer:
-- increase bigint identity columnsselect'DBCC CHECKIDENT('''+QUOTENAME(OBJECT_SCHEMA_NAME(object_id))+'.'+QUOTENAME(object_Name(object_id))+''', RESEED, 2147483648);
'as script
from
sys.identity_columnswhere
system_type_id =127andobject_idin(selectobject_idfrom sys.tables);
-- increase bigint sequencesselect'ALTER SEQUENCE '+QUOTENAME(OBJECT_SCHEMA_NAME(object_id))+'.'+QUOTENAME(object_Name(object_id))+'
RESTART WITH 2147483648 INCREMENT BY '+CAST(increment as sysname)+' NO MINVALUE NO MAXVALUE;
'as script
from
sys.sequenceswhere
system_type_id =127;
-- increase bigint identity columns
select
	'DBCC CHECKIDENT(''' +
	QUOTENAME(OBJECT_SCHEMA_NAME(object_id)) + '.' +
	QUOTENAME(object_Name(object_id)) + ''', RESEED, 2147483648);
' as script
from
	sys.identity_columns
where
	system_type_id = 127
	and object_id in (select object_id from sys.tables);

-- increase bigint sequences
select
	'ALTER SEQUENCE ' +
	QUOTENAME(OBJECT_SCHEMA_NAME(object_id)) + '.' +
	QUOTENAME(object_Name(object_id)) + '
	RESTART WITH 2147483648 INCREMENT BY ' +
	CAST(increment as sysname) +
	' NO MINVALUE NO MAXVALUE;
' as script
from
	sys.sequences
where
	system_type_id = 127;
Prepared for testing
The identity columns in your test database are now prepared for testing. And hopefully you have an automated way to exercise your application code to find sneaky conversions to 4-byte integers. I found several of these hidden defects myself and I’m really glad I had the opportunity to tackle these before they became an issue in production.
When I wrote Take Care When Scripting Batches, I wanted to guard against a common pitfall when implementing a batching solution (n-squared performance). I suggested a way to be careful. But I knew that my solution was not going to be universally applicable to everyone else’s situation. So I wrote that post with a focus on how to evaluate candidate solutions.
But we developers love recipes for problem solving. I wish it was the case that for whatever kind of problem you got, you just stick the right formula in and problem solved. But unfortunately everyone’s situation is different and the majority of questions I get are of the form “What about my situation?” I’m afraid that without extra details, the best advice remains to do the work to set up the tests and find out for yourself.
But despite that. I’m still going to answer some common questions I get. But I’m going to continue to focus on how I evaluate each solution.
(Before reading further, you might want to re-familiarize yourself with the original article Take Care When Scripting Batches).
Here are some questions I get:
What if the clustered index is not unique?
Or what if the clustered index had more than one column such that leading column was not unique. For example, imagine the table was created with this clustered primary key:
How do we write a batching script in that case? It’s usually okay if you just use the leading column of the clustered index. The careful batching script looks like this now:
DECLARE
@LargestKeyProcessed DATETIME='20000101',
@NextBatchMax DATETIME,
@RC INT=1;
WHILE(@RC >0)BEGINSELECTTOP(1000) @NextBatchMax = DateKey
FROM dbo.FactOnlineSalesWHERE DateKey > @LargestKeyProcessed
AND CustomerKey =19036ORDERBY DateKey ASC;
DELETE dbo.FactOnlineSalesWHERE CustomerKey =19036AND DateKey > @LargestKeyProcessed
AND DateKey <= @NextBatchMax;
SET @RC =@@ROWCOUNT;
SET @LargestKeyProcessed = @NextBatchMax;
END
DECLARE
  @LargestKeyProcessed DATETIME = '20000101',
  @NextBatchMax DATETIME,
  @RC INT = 1;

WHILE (@RC > 0)
BEGIN

  SELECT TOP (1000) @NextBatchMax = DateKey
  FROM dbo.FactOnlineSales
  WHERE DateKey > @LargestKeyProcessed
    AND CustomerKey = 19036
  ORDER BY DateKey ASC;

  DELETE dbo.FactOnlineSales
  WHERE CustomerKey = 19036
    AND DateKey > @LargestKeyProcessed
    AND DateKey <= @NextBatchMax;

  SET @RC = @@ROWCOUNT;
  SET @LargestKeyProcessed = @NextBatchMax;

END
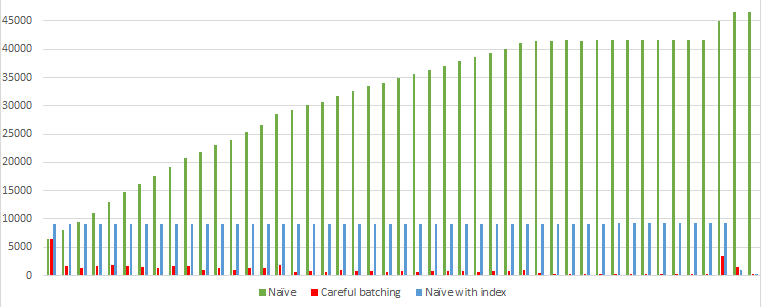
The performance is definitely comparable to the original careful batching script:
Logical Reads Per Delete
But is it correct? A lot of people wonder if the non-unique index breaks the batching somehow. And the answer is yes, but it doesn’t matter too much.
By limiting the batches by DateKey instead of the unique OnlineSalesKey, we are giving up batches that are exactly 1000 rows each. In fact, most of the batches in my test process somewhere between 1000 and 1100 rows and the whole thing requires three fewer batches than the original script. That’s acceptable to me.
If I know that the leading column of the clustering key is selective enough to keep the batch sizes pretty close to the target size, then the script is still accomplishing its goal.
What if the rows I have to delete are sparse?
Here’s another situation. What if instead of customer 19036, we were asked to delete customer 7665? This time, instead of deleting 45100 rows, we only have to delete 379 rows.
I try the careful batching script and see that all rows are deleted in a single batch. SQL Server was looking for batches of 1000 rows to delete. But since there aren’t that many, it scanned the entire table to find just 379 rows. It completed in one batch, but that single batch performed as poorly as the straight algorithm.
One solution is to create an index (online!) for these rows. Something like:
CREATEINDEX IX_CustomerKey
ON dbo.FactOnlineSales(CustomerKey)WITH(ONLINE =ON);
CREATE INDEX IX_CustomerKey
ON dbo.FactOnlineSales(CustomerKey)
WITH (ONLINE = ON);
Most batching scripts are one-time use. So maybe this index is one-time use as well. If it’s a temporary index, just remember to drop it after the script is complete. A temp table could also do the same trick.
With the index, the straight query only needed 3447 logical reads to find all the rows to delete:
DELETE dbo.FactOnlineSales WHERE CustomerKey = 7665;
Logical Reads
Can I use the Naive algorithm if I use a new index?
How does the Naive and other algorithms fare with this new index on dbo.FactOnlineSales(CustomerKey)?
The rows are now so easy to find that the Naive algorithm no longer has the n-squared behavior we worried about earlier. But there is some extra overhead. We have to delete from more than one index. And we’re doing many b-tree lookups (instead of just scanning a clustered index).
DECLARE	@RC INT = 1;

WHILE (@RC > 0)
BEGIN

  DELETE TOP (1000) dbo.FactOnlineSales
  WHERE CustomerKey = 19036;

  SET @RC = @@ROWCOUNT

END
But now with the index, the performance looks like this (category Naive with Index)
The index definitely helps. With the index, the Naive algorithm definitely looks better than it did without the index. But it still looks worse than the careful batching algorithm.
But look at that consistency! Each batch processes 1000 rows and reads exactly the same amount. I might choose to use Naive batching with an index if I don’t know how sparse the rows I’m deleting are. There are a lot of benefits to having a constant runtime for each batch when I can’t guarantee that rows aren’t sparse.
Explore new solutions on your own
There are many different solutions I haven’t explored. This list isn’t comprehensive.
But it’s all tradeoffs. When faced with a choice between candidate solutions, it’s essential to know how to test and measure each solution. SQL Server has more authoritative answers about the behavior of SQL Server than me or any one else. Good luck.
Just like PIVOT syntax, UNPIVOT syntax is hard to remember.
When I can, I prefer to pivot and unpivot in the application, but here’s a function I use sometimes when I want don’t want to scroll horizontally in SSMS.
CREATEORALTERFUNCTION dbo.GenerateUnpivotSql(@SqlNVARCHAR(MAX))RETURNSNVARCHAR(MAX)ASBEGINRETURN'
WITH Q AS
(
SELECT TOP (1) '+(SELECT
STRING_AGG(CAST('CAST('+QUOTENAME(NAME)+' AS sql_variant) AS '+QUOTENAME(NAME)ASNVARCHAR(MAX)), ',
')FROM sys.dm_exec_describe_first_result_set(@sql, DEFAULT, DEFAULT))+'
FROM (
'+ @sql+'
) AS O
)
SELECT U.FieldName, U.FieldValue
FROM Q
UNPIVOT (FieldValue FOR FieldName IN ('+(SELECT STRING_AGG(CAST(QUOTENAME(name)ASNVARCHAR(MAX)), ',
')FROM sys.dm_exec_describe_first_result_set(@sql, DEFAULT, DEFAULT))+'
)) AS U';
END
GO
CREATE OR ALTER FUNCTION dbo.GenerateUnpivotSql (@Sql NVARCHAR(MAX))
  RETURNS NVARCHAR(MAX) AS
BEGIN
RETURN '
WITH Q AS
(
  SELECT TOP (1) ' +
  (
    SELECT
      STRING_AGG(
        CAST(
          'CAST(' + QUOTENAME(NAME) + ' AS sql_variant) AS ' + QUOTENAME(NAME)
          AS NVARCHAR(MAX)
        ), ',
    '
      )
    FROM sys.dm_exec_describe_first_result_set(@sql, DEFAULT, DEFAULT)
  ) + '
  FROM (
    ' + @sql + '
  ) AS O
)
SELECT U.FieldName, U.FieldValue
FROM Q
UNPIVOT (FieldValue FOR FieldName IN (' +
  (
    SELECT STRING_AGG( CAST( QUOTENAME(name) AS NVARCHAR(MAX) ), ',
  ' )
  FROM sys.dm_exec_describe_first_result_set(@sql, DEFAULT, DEFAULT)
  ) + '
  )) AS U';
END
GO
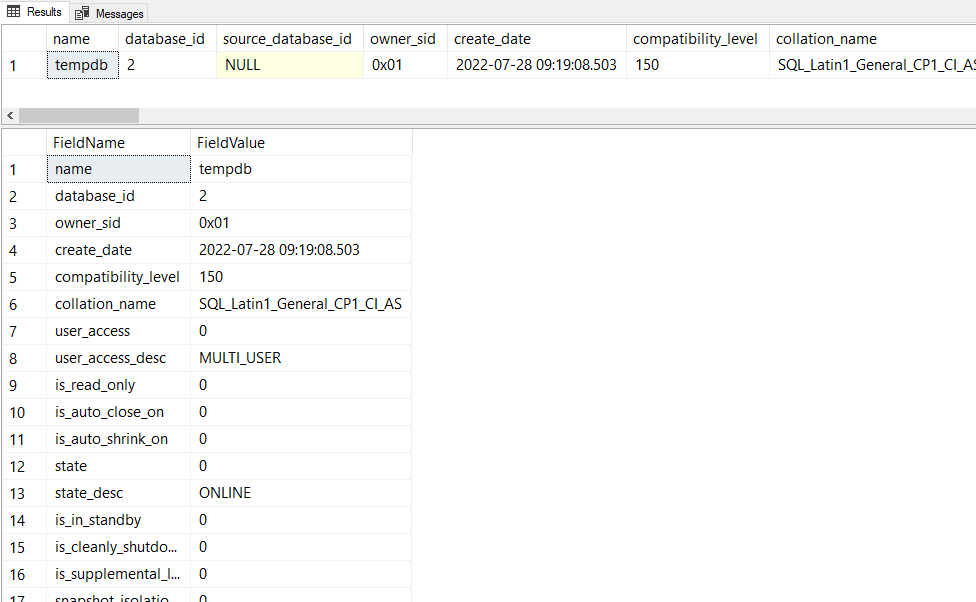
And you might use it like this:
declare @sqlnvarchar(max)='SELECT * FROM sys.databases WHERE database_id = 2';
declare @newsql nvarchar(max)= dbo.GenerateUnpivotSql(@sql);
execsp_executesql @sql;
execsp_executesql @newsql;
I find this function useful whenever I want to take a quick look at one row without all that horizontal scrolling. Like when looking at sys.dm_exec_query_stats and other wide dmvs. This function is minimally tested, so caveat emptor.
System procedures like sp_replincrementlsn and system functions like fn_cdc_get_min_lsn and fn_cdc_get_max_lsn return values that are of type binary(10).
These values represent LSNs, Log Sequence Numbers which are an internal way to represent the ordering of transaction logs.
Typically as developers, we don’t care about these values. But when we do want to dig into the transaction log, we can do so with sys.fn_dblog which takes two optional parameters. These parameters are LSN values which limit the results of sys.fn_dblog. But the weird thing is that sys.fn_dblogis a function whose LSN parameters are NVARCHAR(25).
The function sys.fn_dblog doesn’t expect binary(10) values for its LSN parameters, it wants the LSN values as a formatted string, something like: 0x00000029:00001a3c:0002.
Well, to convert the binary(10) LSN values into the format expected by sys.fn_dblog, I came up with this function:
CREATE OR ALTER FUNCTION dbo.fn_lsn_to_dblog_parameter(
    @lsn BINARY(10)
)
RETURNS NVARCHAR(25)
AS
BEGIN
  RETURN
    NULLIF(
      STUFF (
        STUFF (
          '0x' + CONVERT(NVARCHAR(25), @lsn, 2),
          11, 0, ':' ),
        20, 0, ':' ),
      '0x00000000:00000000:0000'
    )
END
GO
Example
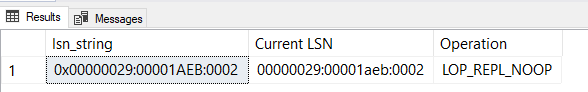
I can increment the LSN once with a no-op and get back the lsn value with sp_replincrementlsn.
I can then use fn_lsn_to_dblog_parameter to get an LSN string to use as parameters to sys.fn_dblog.
This helps me find the exact log entry in the transaction that corresponds to that no-op:
To avoid deadlocks when implementing the upsert pattern, make sure the index on the key column is unique. It’s not sufficient that all the values in that particular column happen to be unique. The index must be defined to be unique, otherwise concurrent queries can still produce deadlocks.
Say I have a table with an index on Id (which is not unique):
CREATETABLE dbo.UpsertTest(
Id INTNOTNULL,
IdString VARCHAR(100)NOTNULL,
INDEX IX_UpsertTest CLUSTERED(Id))
CREATE TABLE dbo.UpsertTest(
	Id INT NOT NULL,
	IdString VARCHAR(100) NOT NULL,
	INDEX IX_UpsertTest CLUSTERED (Id)
)
CREATE OR ALTER PROCEDURE dbo.s_DoSomething
AS
SET TRANSACTION ISOLATION LEVEL SERIALIZABLE
BEGIN TRANSACTION
	DECLARE @Id BIGINT = DATEPART(SECOND, GETDATE());
	DECLARE @IdString VARCHAR(100) = CAST(@Id AS VARCHAR(100));

	IF EXISTS (
		SELECT *
		FROM dbo.UpsertTest WITH (UPDLOCK)
		WHERE Id = @Id
	)
	BEGIN
		UPDATE dbo.UpsertTest
		SET IdString = @IdString
		WHERE Id = @Id;
	END
	ELSE
	BEGIN
		INSERT dbo.UpsertTest (Id, IdString)
		VALUES (@Id, @IdString);
	END;
COMMIT
When I exercise this procedure concurrently with many threads it produces deadlocks! I can use extended events and the output from trace flag 1200 to find out what locks are taken and what order.
What Locks Are Taken?
It depends on the result of the IF statement. There are two main scenarios to look at. Either the row exists or it doesn’t.
Scenario A: The Row Does Not Exist (Insert)
These are the locks that are taken:
For the IF EXISTS statement:
Acquire Range S-U lock on resource (ffffffffffff) which represents “infinity”
For the Insert statement:
Acquire RangeI-N lock on resource (ffffffffffff)
Acquire X lock on resource (66467284bfa8) which represents the newly inserted row
Scenario B: The Row Exists (Update)
The locks that are taken are:
For the IF EXISTS statement:
Acquire Range S-U lock on resource (66467284bfa8)
For the Update statement:
Acquire RangeX-X lock on resource (66467284bfa8)
Acquire RangeX-X lock on resource (ffffffffffff)
Scenario C: The Row Does Not Exist, But Another Process Inserts First (Update)
There’s a bonus scenario that begins just like the Insert scenario, but the process is blocked waiting for resource (ffffffffffff). Once it finally acquires the lock, the next locks that are taken look the same as the other Update scenario. The locks that are taken are:
For the IF EXISTS statement:
Wait for Range S-U lock on resource (ffffffffffff)
Acquire Range S-U lock on resource (ffffffffffff)
Acquire Range S-U lock on resource (66467284bfa8)
For the Update statement:
Acquire RangeX-X lock on resource (66467284bfa8)
Acquire RangeX-X lock on resource (ffffffffffff)
The Deadlock
And when I look at the deadlock graph, I can see that the two update scenarios (Scenario B and C) are fighting: Scenario B:
Acquire RangeX-X lock on resource (66467284bfa8) during UPDATE
Blocked RangeX-X lock on resource (ffffffffffff) during UPDATE
Scenario C:
Acquire RangeS-U lock on resource (ffffffffffff) during IF EXISTS
Blocked RangeS-U lock on resource (66467284bfa8) during IF EXISTS
Why Isn’t This A Problem With Unique Indexes?
To find out, let’s take a look at one last scenario where the index is unique: Scenario D: The Row Exists (Update on Unique Index)
For the IF EXISTS statement:
Acquire U lock on resource (66467284bfa8)
For the Update statement:
Acquire X lock on resource (66467284bfa8)
Visually, I can compare scenario B with Scenario D:
When the index is not unique, SQL Server has to take key-range locks on either side of the row to prevent phantom inserts, but it’s not necessary when the values are guaranteed to be unique! And that makes all the difference. When the index is unique, no lock is required on resource (ffffffffffff). There is no longer any potential for a deadlock.
Solution: Define Indexes As Unique When Possible
Even if the values in a column are unique in practice, you’ll help improve concurrency by defining the index as unique. This tip can be generalized to other deadlocks. Next time you’re troubleshooting a deadlock involving range locks, check to see whether the participating indexes are unique.
This quirk of requiring unique indexes for the UPSERT pattern is not unique to SQL Server, I notice that PostgreSQL requires a unique index when using their “ON CONFLICT … UPDATE” syntax. This is something they chose to do very deliberately.
Other Things I Tried
This post actually comes from a real problem I was presented. It took a while to reproduce and I tried a few things before I settled on making my index unique.
Lock More During IF EXISTS?
Notice that there is only one range lock taken during the IF EXISTS statement, but there are two range needed for the UPDATE statement. Why is only one needed for the EXISTS statement? If extra rows get inserted above the row that was read, that doesn’t change the answer to EXISTS. So it’s technically not a phantom read and so SQL Server doesn’t take that lock.
So what if I changed my IF EXISTS to
IF(SELECTCOUNT(*)FROM dbo.UpsertTestWITH(UPDLOCK)WHERE Id = @Id
)>0
IF (
	SELECT COUNT(*)
	FROM dbo.UpsertTest WITH (UPDLOCK)
	WHERE Id = @Id
) > 0
That IF statement now takes two range locks which is good, but it still gets tripped up with Scenario C and continues to deadlock.
Update Less?
Change the update statement to only update one row using TOP (1)
UPDATETOP(1) dbo.UpsertTestSET IdString = @IdString
WHERE Id = @Id;
UPDATE TOP (1) dbo.UpsertTest
SET IdString = @IdString
WHERE Id = @Id;
During the update statement, this only requires one RangeX-X lock instead of two. And that technique actually works! I was unable to reproduce deadlocks with TOP (1). So it is indeed a candidate solution, but making the index unique is still my preferred method.
The configuration setting cost threshold for parallelism has a default value of 5. As a default value, it’s probably too low and should be raised. But what benefit are we hoping for? And how can we measure it?
The database that I work with is a busy OLTP system with lots of very frequent, very inexpensive queries and so I don’t like to see any query that needs to go parallel.
What I’d like to do is raise the configuration cost threshold to something larger and look at the queries that have gone from multi-threaded to single-threaded. I want to see that these queries become cheaper on average. By cheaper I mean consume less cpu. I expect the average duration of these queries to increase.
How do I find these queries? I can look in the cache. The view sys.dm_exec_query_stats can tell me if a query plan is parallel, and I can look into the plans for the estimated cost. In my case, I have relatively few parallel queries. Only about 300 which means the xml parsing piece of this query runs pretty quickly.
WITH XMLNAMESPACES (DEFAULT 'http://schemas.microsoft.com/sqlserver/2004/07/showplan')
SELECT
	sql_text.[text] as sqltext,
	qp.query_plan,
	xml_values.subtree_cost as estimated_query_cost_in_query_bucks,
	qs.last_dop,
	CAST( qs.total_worker_time / (qs.execution_count + 0.0) as money ) as average_query_cpu_in_microseconds,
	qs.total_worker_time,
	qs.execution_count,
	qs.query_hash,
	qs.query_plan_hash,
	qs.plan_handle,
	qs.sql_handle
FROM sys.dm_exec_query_stats qs
CROSS APPLY sys.dm_exec_sql_text(qs.sql_handle) st
CROSS APPLY sys.dm_exec_query_plan (qs.plan_handle) qp
CROSS APPLY
	(
		SELECT SUBSTRING(st.[text],(qs.statement_start_offset + 2) / 2,
		(CASE
			WHEN qs.statement_end_offset = -1  THEN LEN(CONVERT(NVARCHAR(MAX),st.[text])) * 2
			ELSE qs.statement_end_offset + 2
			END - qs.statement_start_offset) / 2)
	) as sql_text([text])
OUTER APPLY
	(
		SELECT
			n.c.value('@QueryHash', 'NVARCHAR(30)')  as query_hash,
			n.c.value('@StatementSubTreeCost', 'FLOAT')  as subtree_cost
		FROM qp.query_plan.nodes('//StmtSimple') as n(c)
	) xml_values
WHERE qs.last_dop > 1
AND sys.fn_varbintohexstr(qs.query_hash) = xml_values.query_hash
AND execution_count > 10
ORDER BY xml_values.subtree_cost
OPTION (RECOMPILE);
What Next?
Keep track of the queries you see whose estimated subtree cost is below the new threshold you’re considering. Especially keep track of the query_hash and the average_query_cpu_in_microseconds.
Then make the change and compare the average_query_cpu_in_microseconds before and after. Remember to use the sql_hash as the key because the plan_hash will have changed.
Here’s the query modified to return the “after” results:
Measure the Cost of Those Queries After Config Change
WITH XMLNAMESPACES (DEFAULT'http://schemas.microsoft.com/sqlserver/2004/07/showplan')SELECT
sql_text.[text]as sqltext,
qp.query_plan,
xml_values.subtree_costas estimated_query_cost_in_query_bucks,
qs.last_dop,
CAST( qs.total_worker_time/(qs.execution_count+0.0)asmoney)as average_query_cpu_in_microseconds,
qs.total_worker_time,
qs.execution_count,
qs.query_hash,
qs.query_plan_hash,
qs.plan_handle,
qs.sql_handleFROM sys.dm_exec_query_stats qs
CROSS APPLY sys.dm_exec_sql_text(qs.sql_handle) st
CROSS APPLY sys.dm_exec_query_plan(qs.plan_handle) qp
CROSS APPLY
(SELECTSUBSTRING(st.[text],(qs.statement_start_offset+2)/2,
(CASEWHEN qs.statement_end_offset=-1THENLEN(CONVERT(NVARCHAR(MAX),st.[text]))*2ELSE qs.statement_end_offset+2END- qs.statement_start_offset)/2))as sql_text([text])OUTER APPLY
(SELECT
n.c.value('@QueryHash', 'NVARCHAR(30)')as query_hash,
n.c.value('@StatementSubTreeCost', 'FLOAT')as subtree_cost
FROM qp.query_plan.nodes('//StmtSimple')as n(c)) xml_values
WHERE qs.query_hashin(/* put the list of sql_handles you saw from before the config change here */)AND sys.fn_varbintohexstr(qs.query_hash)= xml_values.query_hashORDERBY xml_values.subtree_costOPTION(RECOMPILE);
WITH XMLNAMESPACES (DEFAULT 'http://schemas.microsoft.com/sqlserver/2004/07/showplan')
SELECT
	sql_text.[text] as sqltext,
	qp.query_plan,
	xml_values.subtree_cost as estimated_query_cost_in_query_bucks,
	qs.last_dop,
	CAST( qs.total_worker_time / (qs.execution_count + 0.0) as money ) as average_query_cpu_in_microseconds,
	qs.total_worker_time,
	qs.execution_count,
	qs.query_hash,
	qs.query_plan_hash,
	qs.plan_handle,
	qs.sql_handle
FROM sys.dm_exec_query_stats qs
CROSS APPLY sys.dm_exec_sql_text(qs.sql_handle) st
CROSS APPLY sys.dm_exec_query_plan (qs.plan_handle) qp
CROSS APPLY
	(
		SELECT SUBSTRING(st.[text],(qs.statement_start_offset + 2) / 2,
		(CASE
			WHEN qs.statement_end_offset = -1  THEN LEN(CONVERT(NVARCHAR(MAX),st.[text])) * 2
			ELSE qs.statement_end_offset + 2
			END - qs.statement_start_offset) / 2)
	) as sql_text([text])
OUTER APPLY
	(
		SELECT
			n.c.value('@QueryHash', 'NVARCHAR(30)')  as query_hash,
			n.c.value('@StatementSubTreeCost', 'FLOAT')  as subtree_cost
		FROM qp.query_plan.nodes('//StmtSimple') as n(c)
	) xml_values
WHERE qs.query_hash in ( /* put the list of sql_handles you saw from before the config change here */ )
AND sys.fn_varbintohexstr(qs.query_hash) = xml_values.query_hash
ORDER BY xml_values.subtree_cost
OPTION (RECOMPILE);
What I Found
In general, increasing the threshold from 5 –> 50 generally had a very good effect on those queries that went from multithreaded to singlethreaded. Over half of the queries improved at least 1 order of magnitude (and a couple improved 3 orders of magnitude!) https://t.co/iELhiSr7Onpic.twitter.com/W4Mv7hGVlz
I have trouble with procedures that use SELECT *. They are often not “Blue-Green safe“. In other words, if a procedure has a query that uses SELECT * then I can’t change the underlying tables can’t change without causing some tricky deployment issues. (The same is not true for ad hoc queries from the application).
I also have a lot of procedures to look at (about 5000) and I’d like to find the procedures that use SELECT *.
I want to maybe ignore SELECT * when selecting from a subquery with a well-defined column list.
I also want to maybe include related queries like OUTPUT inserted.*.
The Plan
So I’m going to make a schema-only copy of the database to work with.
I’m going to add a new dummy-column to every single table.
I’m going to use sys.dm_exec_describe_first_result_set_for_object to look for any of the new columns I created
Any of my new columns that show up, were selected with SELECT *.
The Script
use master;
DROPDATABASEIFEXISTS search_for_select_star;
DBCC CLONEDATABASE (the_name_of_the_database_you_want_to_analyze, search_for_select_star);
ALTERDATABASE search_for_select_star SET READ_WRITE;
GO
use search_for_select_star;
DECLARE @SQLNVARCHAR(MAX);
SELECT
@SQL= STRING_AGG(CAST('ALTER TABLE '+QUOTENAME(OBJECT_SCHEMA_NAME(object_id))+'.'+QUOTENAME(OBJECT_NAME(object_id))+' ADD NewDummyColumn BIT NULL'ASNVARCHAR(MAX)),
N';')FROM
sys.tables;
execsp_executesql @SQL;
SELECT
SCHEMA_NAME(p.schema_id)+'.'+ p.nameAS procedure_name,
r.column_ordinal,
r.nameFROM
sys.procedures p
CROSS APPLY
sys.dm_exec_describe_first_result_set_for_object(p.object_id, NULL) r
WHERE
r.name='NewDummyColumn'ORDERBY
p.schema_id, p.name;
use master;
DROPDATABASEIFEXISTS search_for_select_star;
use master;
DROP DATABASE IF EXISTS search_for_select_star;
DBCC CLONEDATABASE (the_name_of_the_database_you_want_to_analyze, search_for_select_star);
ALTER DATABASE search_for_select_star SET READ_WRITE;
GO

use search_for_select_star;

DECLARE @SQL NVARCHAR(MAX);
SELECT
	@SQL = STRING_AGG(
		CAST(
			'ALTER TABLE ' +
			QUOTENAME(OBJECT_SCHEMA_NAME(object_id)) +
			'.' +
			QUOTENAME(OBJECT_NAME(object_id)) +
			' ADD NewDummyColumn BIT NULL' AS NVARCHAR(MAX)),
		N';')
FROM
	sys.tables;

exec sp_executesql @SQL;

SELECT
	SCHEMA_NAME(p.schema_id) + '.' + p.name AS procedure_name,
	r.column_ordinal,
	r.name
FROM
	sys.procedures p
CROSS APPLY
	sys.dm_exec_describe_first_result_set_for_object(p.object_id, NULL) r
WHERE
	r.name = 'NewDummyColumn'
ORDER BY
	p.schema_id, p.name;

use master;
DROP DATABASE IF EXISTS search_for_select_star;
Update
Tom from StraightforwardSQL pointed out a nifty feature that Microsoft has already implemented.
Not sure here, but doesn't dm_sql_referenced_entities.is_select_all achieve the same thing?
selectdistinct SCHEMA_NAME(p.schema_id)+'.'+ p.nameAS procedure_name
from sys.procedures p
cross apply sys.dm_sql_referenced_entities(
object_schema_name(object_id)+'.'+object_name(object_id), default) re
where re.is_select_all=1
select distinct SCHEMA_NAME(p.schema_id) + '.' + p.name AS procedure_name
from sys.procedures p
cross apply sys.dm_sql_referenced_entities(
	object_schema_name(object_id) + '.' + object_name(object_id), default) re
where re.is_select_all = 1
Comparing the two, I noticed that my query – the one that uses dm_exec_describe_first_result_set_for_object – has some drawbacks. Maybe the SELECT * isn’t actually included in the first result set, but some subsequent result set. Or maybe the result set couldn’t be described for one of these various reasons
On the other hand, I noticed that dm_sql_referenced_entities has a couple drawbacks itself. It doesn’t seem to capture select statements that use `OUTPUT INSERTED.*` for example.
In practice though, I found the query that Tom suggested works a bit better. In the product I work most closely with, dm_sql_referenced_entities only missed 3 procedures that dm_exec_describe_first_result_set_for_object caught. But dm_exec_describe_first_result_set_for_object missed 49 procedures that dm_sql_referenced_entities caught!
Takeaway: For most use cases, using sp_releaseapplock is unnecessary. Especially when using @LockOwner = 'Transaction (which is the default).
The procedure sp_getapplock is a system stored procedure that can be helpful when developing SQL for concurrency. It takes a lock on an imaginary resource and it can be used to avoid race conditions.
But I don’t use sp_getapplock a lot. I almost always depend on SQL Server’s normal locking of resources (like tables, indexes, rows etc…). But I might consider it for complicated situations (like managing sort order in a hierarchy using a table with many different indexes).
But there’s a problem with this pattern, especially when using RCSI. After sp_releaseapplock is called, but before the COMMIT completes, another process running the same code can read the previous state. In the example above, both processes will think a time slot is available and will try to make the same reservation.
What I really want is to release the applock after the commit. But because I specified the lock owner is 'Transaction'. That gets done automatically when the transaction ends! So really what I want is this:
BEGINTRANexecsp_getapplock
@Resource = @LockResourceName,
@LockMode ='Exclusive',
@LockOwner ='Transaction';
/* read stuff (e.g. "is time slot available?") *//* change stuff (e.g. "make reservation") */COMMIT-- all locks are freed after this commit
BEGIN TRAN

exec sp_getapplock
    @Resource = @LockResourceName,
    @LockMode = 'Exclusive',
    @LockOwner = 'Transaction';

/* read stuff (e.g. "is time slot available?") */
/* change stuff (e.g. "make reservation") */

COMMIT -- all locks are freed after this commit