


Takeaway: WRITELOG waits are associated with a busy or slow transaction log. To tackle these waits, we need to measure transaction log activity. I describe a lightweight way to examine transaction log usage for busy OLTP systems.
Start with Microsoft’s Advice: I’m not going to introduce the topic of transaction log performance. Microsoft’s SQL Customer Advisory Team already provides a great introduction with Diagnosing Transaction Log Performance Issues and Limits of the Log Manager. Their advice includes watching the “Log Bytes Flushed/sec” performance counter found in the “SQL Server:Databases” object.
Reactive Efforts: If you’re curious about transaction log activity for open transactions, Paul Randal has a script at Script: open transactions with text and plans.
Spiky Activity: It’s not too difficult to find infrequent activities that write a lot of data to the transaction log; activities like data warehouse ETLs, or index rebuilds. Use a trace or extended events to look for statements with large values for “writes”.
Scalability of OLTP Workloads
WRITELOG waits are a scalability challenge for OLTP workloads under load. Chris Adkin has a lot of experience tuning SQL Server for high-volume OLTP workloads. So I’m going to follow his advice when he writes we should minimize the amount logging generated. And because I can’t improve something if I can’t measure it, I wonder what’s generating the most logging? OLTP workloads are characterized by frequent tiny transactions so I want to measure that activity without filters, but I want to have as little impact to the system as I can. That’s my challenge.
Getting #SQLHelp
So I asked twitter. And I got some great advice from Erin Stellato:
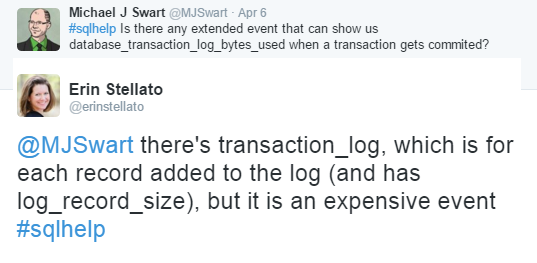
Erin also pointed out that the UI warns you that it’s a very high volume event.
Combining fn_dblog With Extended Events
So to avoid that kind of volume, I got the idea to read straight from the transaction log and combine that with a lighter extended events session to get the SQL text. The transaction_id captured by the extended events session corresponds to the XAct ID column in fn_dblog.
Here’s how that went:
The Script
The details for this script are kind of fussy, but it all comes together in a solution that won’t drag a server down. Care is still recommended; start with 10 seconds and go from there.
declare @Duration varchar(10) = '00:00:10'; declare @FileSize varchar(10) = '5'; -- in megabytes -- create session DECLARE @CreateSessionSQL nvarchar(max) = N' CREATE EVENT SESSION query_writes ON SERVER ADD EVENT sqlserver.sp_statement_completed ( SET collect_statement=(0) ACTION(sqlserver.transaction_id, sqlserver.database_name) WHERE sqlserver.transaction_id > 0 AND sqlserver.database_name = ''' + DB_NAME() + N''') ADD TARGET package0.asynchronous_file_target( SET filename = N''query_writes.xel'', max_file_size = ' + @FileSize + N', max_rollover_files = 1) WITH ( STARTUP_STATE=ON, EVENT_RETENTION_MODE=ALLOW_SINGLE_EVENT_LOSS, TRACK_CAUSALITY=OFF)'; exec sp_executesql @CreateSessionSQL; ALTER EVENT SESSION query_writes ON SERVER STATE=START; -- get the latest lsn for current DB declare @xact_seqno binary(10); declare @xact_seqno_string_begin varchar(50); exec sp_replincrementlsn @xact_seqno OUTPUT; set @xact_seqno_string_begin = '0x' + CONVERT(varchar(50), @xact_seqno, 2); set @xact_seqno_string_begin = stuff(@xact_seqno_string_begin, 11, 0, ':') set @xact_seqno_string_begin = stuff(@xact_seqno_string_begin, 20, 0, ':'); -- wait a minute waitfor delay @Duration; -- get the latest lsn for current DB declare @xact_seqno_string_end varchar(50); exec sp_replincrementlsn @xact_seqno OUTPUT; set @xact_seqno_string_end = '0x' + CONVERT(varchar(50), @xact_seqno, 2); set @xact_seqno_string_end = stuff(@xact_seqno_string_end, 11, 0, ':') set @xact_seqno_string_end = stuff(@xact_seqno_string_end, 20, 0, ':'); -- Stop the session ALTER EVENT SESSION query_writes ON SERVER STATE=STOP; -- read from transaction log select max([Xact ID]) as transactionId, max([Transaction Name]) as transactionName, sum([Log Record Length]) as logSize, count(*) as [logRowCount] into #TLOGS from fn_dblog(@xact_seqno_string_begin, @xact_seqno_string_end) f group by [Transaction Id] -- read from session data CREATE TABLE #SessionData ( id int identity primary key, XEXml xml NOT NULL ) INSERT #SessionData(XEXml) SELECT CAST(fileData.[event_data] as xml) FROM sys.fn_xe_file_target_read_file ( 'query_writes*xel', null, null, null) fileData; -- find minimum transactionId captured by xes -- (almost always the first one, depending on luck here) declare @minTXFromSession bigint; select TOP (1) @minTXFromSession = S.XEXml.value( '(/event/action[(@name=''transaction_id'')]/value)[1]', 'bigint') from #SessionData S; WITH SD AS ( SELECT S.XEXml.value( '(/event/action[(@name=''transaction_id'')]/value)[1]', 'bigint') as transactionId, S.XEXml.value( '(/event/data[(@name=''object_id'')]/value)[1]', 'bigint') as objectId FROM #SessionData S ) SELECT ISNULL(T.transactionName, 'Unknown') as transactionTypeName, OBJECT_NAME(S.objectid) as ObjectName, SUM(T.logsize) as totalLogSizeBytes, SUM(T.logRowCount) as totalLogRowCount, COUNT(*) as executions FROM #TLOGS T LEFT JOIN (SELECT DISTINCT * FROM SD) S ON T.transactionId = S.transactionId WHERE T.transactionId >= @minTXFromSession GROUP BY T.transactionName, S.objectId ORDER BY SUM(T.logsize) DESC -- clean up DROP EVENT SESSION query_writes ON SERVER; DROP TABLE #TLOGS DROP TABLE #SessionData |
Sample Results
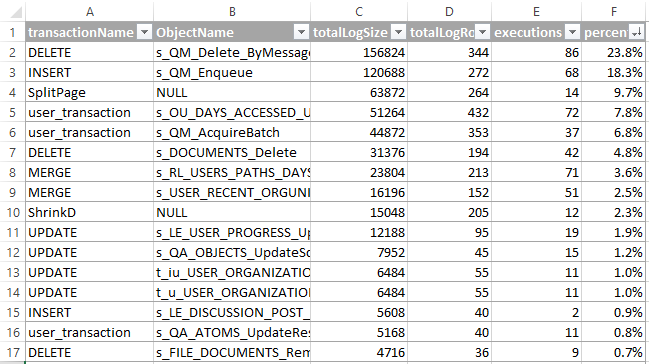
Here’s an example of what the results would look like. It’s an aggregated view of all transaction log activity in a database for 10 seconds.
Notes
- Notice that the session is database specific. That’s because transaction logs are database specific. To help focus on the right database, use the “Log Bytes Flushed/sec” performance counter found in the “SQL Server:Databases” object.
- Also notice that I’m tracking ObjectIds. That’s because we use procedures quite heavily. You may want to adapt this code to use query_hash instead. In both cases, collecting the statement text is not recommended.
- The sample of data is limited by the size of the extended events target file or the duration variable, whichever is smaller.
- @sqL_handLe pointed out to me that reading the log using
fn_dblogwill prevent the transaction log from truncating. Reading from the transaction log can be very tricky to do efficiently. Luckily we can use thesp_replincrementlsntrick to get LSN parameter values forfn_dblog.

[…] What statements are responsible for the most transaction log? […]
Pingback by Build Your Own Tools | Michael J. Swart — September 23, 2016 @ 8:38 am
[…] curious about, you may want to drill down further. I wrote about this problem earlier in Tackle WRITELOG Waits Using the Transaction Log and Extended Events. The query I wrote for that post combines results of an extended events session with the […]
Pingback by What Tables Are Being Written To The Most? | Michael J. Swart — January 28, 2020 @ 10:38 am