


You have excessive WRITELOG waits (or HADR_SYNC_COMMIT waits) and among other things, you want to understand where.
Microsoft’s advice Diagnosing Transaction Log Performance Issues and Limits of the Log Manager remains a great resource. They tell you to use perfmon to look at the log bytes flushed/sec counter (in the SQL Server:Databases object) to see which database is being written to so much.
After identifying a database you’re curious about, you may want to drill down further. I wrote about this problem earlier in Tackle WRITELOG Waits Using the Transaction Log and Extended Events. The query I wrote for that post combines results of an extended events session with the transaction log in order to identify which procedures are doing the most writing.
But it’s a tricky kind of script. It takes a while to run on busy systems. There’s a faster way to drill into writes if you switch your focus from which queries are writing so much to which tables are being written to so much. Both methods of drilling down can be helpful, but the table approach is faster and doesn’t require an extended event session and it might be enough to point you in the right direction.
Use This Query
use [specify your databasename here] -- get the latest lsn for current DB declare @xact_seqno binary(10); declare @xact_seqno_string_begin varchar(50); exec sp_replincrementlsn @xact_seqno OUTPUT; set @xact_seqno_string_begin = '0x' + CONVERT(varchar(50), @xact_seqno, 2); set @xact_seqno_string_begin = stuff(@xact_seqno_string_begin, 11, 0, ':') set @xact_seqno_string_begin = stuff(@xact_seqno_string_begin, 20, 0, ':'); -- wait a few seconds waitfor delay '00:00:10' -- get the latest lsn for current DB declare @xact_seqno_string_end varchar(50); exec sp_replincrementlsn @xact_seqno OUTPUT; set @xact_seqno_string_end = '0x' + CONVERT(varchar(50), @xact_seqno, 2); set @xact_seqno_string_end = stuff(@xact_seqno_string_end, 11, 0, ':') set @xact_seqno_string_end = stuff(@xact_seqno_string_end, 20, 0, ':'); WITH [Log] AS ( SELECT Category, SUM([Log Record Length]) as [Log Bytes] FROM fn_dblog(@xact_seqno_string_begin, @xact_seqno_string_end) CROSS APPLY (SELECT ISNULL(AllocUnitName, Operation)) AS C(Category) GROUP BY Category ) SELECT Category, [Log Bytes], 100.0 * [Log Bytes] / SUM([Log Bytes]) OVER () AS [%] FROM [Log] ORDER BY [Log Bytes] DESC; |
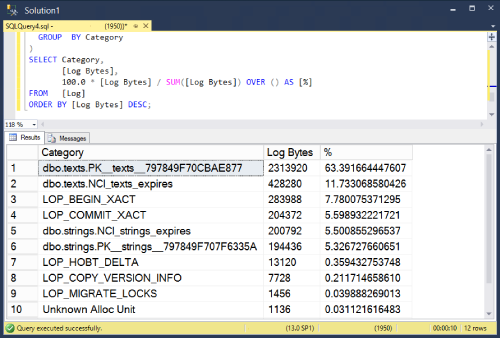
Results look something like this (Your mileage may vary).
Notes
- Notice that some space in the transaction log is not actually about writing to tables. I’ve grouped them into their own categories and kept them in the results. For example
LOP_BEGIN_XACTrecords information about the beginning of transactions. - I’m using
sp_replincrementlsnto find the current last lsn. I could have usedlog_min_lsnfromsys.dm_db_log_statsbut that dmv is only available in 2016 SP2 and later. - This method is a little more direct measurement of transaction log activity than a similar query that uses
sys.dm_db_index_operational_stats

[…] Michael J Swart has an interesting query for us: […]
Pingback by Finding Tables with High Write Frequency – Curated SQL — January 29, 2020 @ 7:59 am