


The beginning of the school year is behind us and what a semester start! 2020 has been tough on many of us and I’m fortunate to work for a company whose services are in such high demand. In fact we’ve seen some scaling challenges like we’ve never seen before. I want to talk about some of them.
- Maximum Simultaneous User Connections
- In Memory OLTP Defeated Our Tempdb Problems
- Detect Excessive Spinlock Contention on SQL Server

Context
As we prepared to face unprecedented demand this year, we began to think about whether bigger is better. Worried about CPU limits, we looked to what AWS had to offer in terms of their instance sizes.
We were already running our largest SQL Servers on r5 instances with 96 logical CPUs. But we decided to evaluate the pricy u instances which have 448 logical CPUs and a huge amount of memory.
Painful Symptoms
Well, bigger is not always better. We discovered that as we increased the load on the u-series servers, there would come a point where all processors would jump to 100% and stayed there. You could say it plateaued (based on the graph, would that be a plateau? A mesa? Or a butte?)
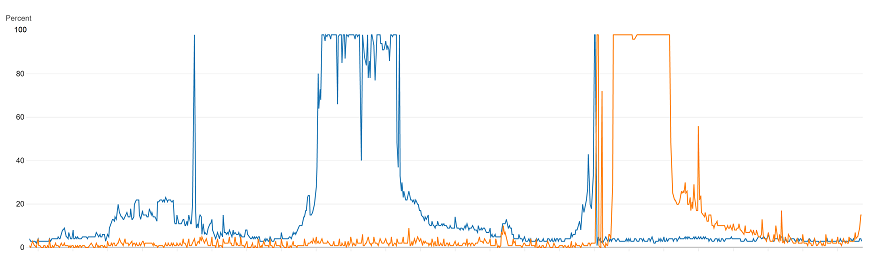
When that occurred, the number of batch requests that the server could handle dropped significantly. So we saw more CPU use, but less work was getting done.
The high demand kept the CPU at 100% with no relief until the demand decreased. When that happened, the database seemed to recover. Throughput was restored and the database’s metrics became healthy again. During this trouble we looked at everything including the number of spins reported in the sys.dm_os_spinlock_stats dmv.
The spins and backoffs reported seemed extremely high, especially for the category “XVB_LIST”, but we didn’t really have a baseline to tell whether those numbers were problematic. Even after capturing the numbers and visualizing them we saw larger than linear increases as demand increased, but were those increases excessive?
How To Tell For Sure
Chris Adkin has a post Diagnosing Spinlock Problems By Doing The Math. He explains why spinlocks are useful. It doesn’t seem like a while loop that chews up CPU could improve performance, but it actually does when it helps avoid context switches. He gives a formula to help find how much of the total CPU is spent spinning. That percentage can then help decide whether the spinning is excessive.
But I made a tiny tweak to his formula and I wrote a script to have SQL Server do the math:
- You still have to give the number of CPUs on your server. If you don’t have those numbers handy, you can get them from SQL Server’s log. I include one of Glenn Berry’s diagnostic queries for that.
- There’s an assumption in Chris’s calculation that one spin consumes one CPU clock cycle. A spin is really cheap (because it can use the test-and-set instruction), but it probably consumes more than one clock cycle. I assume four, but I have no idea what the actual value is.
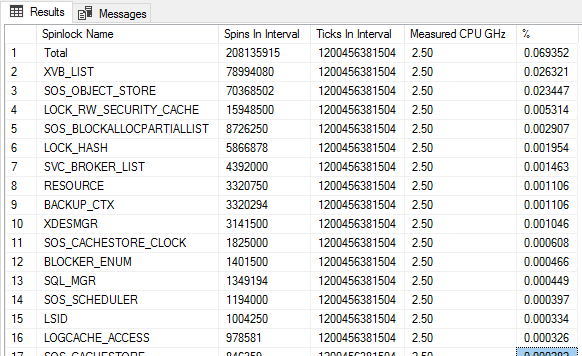
EXEC sys.xp_readerrorlog 0, 1, N'detected', N'socket'; -- SQL Server detected 2 sockets with 24 cores per socket ... declare @Sockets int = 2; declare @PhysicalCoresPerSocket int = 24; declare @TicksPerSpin int = 4; declare @SpinlockSnapshot TABLE ( SpinLockName VARCHAR(100), SpinTotal BIGINT ); INSERT @SpinlockSnapshot ( SpinLockName, SpinTotal ) SELECT name, spins FROM sys.dm_os_spinlock_stats WHERE spins > 0; DECLARE @Ticks bigint SELECT @Ticks = cpu_ticks FROM sys.dm_os_sys_info WAITFOR DELAY '00:00:10' DECLARE @TotalTicksInInterval BIGINT DECLARE @CPU_GHz NUMERIC(20, 2); SELECT @TotalTicksInInterval = (cpu_ticks - @Ticks) * @Sockets * @PhysicalCoresPerSocket, @CPU_GHz = ( cpu_ticks - @Ticks ) / 10000000000.0 FROM sys.dm_os_sys_info; SELECT ISNULL(Snap.SpinLockName, 'Total') as [Spinlock Name], SUM(Stat.spins - Snap.SpinTotal) as [Spins In Interval], @TotalTicksInInterval as [Ticks In Interval], @CPU_Ghz as [Measured CPU GHz], 100.0 * SUM(Stat.spins - Snap.SpinTotal) * @TicksPerSpin / @TotalTicksInInterval as [%] FROM @SpinlockSnapshot Snap JOIN sys.dm_os_spinlock_stats Stat ON Snap.SpinLockName = Stat.name GROUP BY ROLLUP (Snap.SpinLockName) HAVING SUM(Stat.spins - Snap.SpinTotal) > 0 ORDER BY [Spins In Interval] DESC; |
This is what I see on a very healthy server (r5.24xlarge). The server was using 14% cpu. And .03% of that is spent spinning (or somewhere in that ballpark).
More Troubleshooting Steps
So what’s going on? What is that XVB_LIST category? Microsoft says “internal use only” But I can guess. Paul Randal talks about the related latch class Versioning Transaction List. It’s an instance-wide list that is used in the implementation of features like Read Committed Snapshot Isolation (RCSI) which we do use.
Microsoft also has a whitepaper on troubleshooting this stuff Diagnose and resolve spinlock contention on SQL Server. They actually give a technique to collect call stacks during spinlock contention in order to try and maybe glean some information about what else is going on. We did that, but we didn’t learn too much. We learned that we use RCSI with lots of concurrent queries. Something we really can’t give up on.
So Then What?
What We Did
Well, we moved away from the u instance with its hundreds of CPUs and we went back to our r5 instance with only (only!) 96 logical CPUs. We’re dealing with the limits imposed by that hardware and accepting that we can’t scale higher using that box. We’re continuing to do our darnedest to move data and activity out of SQL Server and into other solutions like DynamoDb. We’re also trying to partition our databases into different deployments which spreads the load out, but introduces a lot of other challenges.
Basically, we gave up trying to scale higher. If we did want to pursue this further (which we don’t), we’d probably contact Microsoft support to try and address this spinlock contention. We know that these conditions are sufficient (if not necessary) to see the contention we saw:
- SQL Server 2016 SP2
- U-series instance from Amazon
- Highly concurrent and frequent queries (>200K batch requests per second with a good mix of writes and reads on the same tables)
- RCSI enabled.
Thank you Erin Stellato
We reached out to Erin Stellato to help us through this issue. We did this sometime around the “Painful Symptoms” section above. We had a stressful time troubleshooting all this stuff and I really appreciate Erin guiding us through it. We learned so much.

Shouldn’t the declare @Sockets int = 42; be declare @Sockets int = 2; ?
It also looks like the formatting for the blog messed up these statements:
WHERE spins > 0;
HAVING SUM(Stat.spins – Snap.SpinTotal) > 0
I’m guessing they should be > 0
Comment by Glenn Berry — October 28, 2020 @ 11:43 pm
Thanks for catching that Glenn!
And thanks for the diagnostic queries you’ve written. You’ve probably noticed I made use of them.
Michael
Comment by Michael J. Swart — October 28, 2020 @ 11:49 pm
>200K batch requests per second, holy carp. I’d say that’s definitely pushing the limits (or even beyond the limits, heh?) of a single instance, and that’s not the best position to be in. Scaling out a big monolith is a huge pain but it’s definitely the right direction.
Comment by Alex Friedman — October 29, 2020 @ 5:17 am
Hey Alex,
“or even beyond the limits” <-- too true!!!! and "huge pain" is right too. Sounds like you've been in a similar spot!
Comment by Michael J. Swart — October 29, 2020 @ 9:07 am
[…] Michael J. Swart walks us through spinlock contention: […]
Pingback by Detecting Spinlock Contention in SQL Server – Curated SQL — October 29, 2020 @ 8:05 am
[…] PowerBI or even Excel). For example, here’s a chart I made when we were experiencing the XVB_LIST spinlock issues I wrote about not too long ago. Good visualizations can really tell powerful […]
Pingback by Collect Wait Stats Regularly in Order To Report On Them Over Time | Michael J. Swart — January 8, 2021 @ 12:48 pm
An update to this issue, if you recognize this symptoms, check out this potential bug fix (which came out after this post)
https://support.microsoft.com/en-us/topic/kb4588984-fix-contention-on-xvb-list-spinlock-in-highly-concurrent-workloads-when-using-rcsi-703f6695-9391-13c9-fe72-a7a836146f03
Comment by Michael J. Swart — November 9, 2023 @ 2:29 pm