I find wait stats so useful that I’ve got Paul Randal’s SQL Server Wait Statistics (or please tell me where it hurts…) bookmarked and I visit it frequently.
But that gives the total amount of waits for each wait type accumulated since the server was started. And that isn’t ideal when I’m troubleshooting trouble that started recently. No worries, Paul also has another fantastic post Capturing wait statistics for a period of time.
Taking that idea further, I can collect data all the time and look at it historically, or just for a baseline. Lot’s of monitoring tools do this already, but here’s what I’ve written:
- CollectWaitStats, a repo on github
- Or just the scripts to create the db objects: WaitStats/CreateObjects.sql
Mostly I’m creating these scripts for me. I’ve created a version of these a few times now and some reason, I can’t find them each time I need them again!
This stuff can be super useful, especially, if you combine it with a visualization tool (like PowerBI or even Excel).
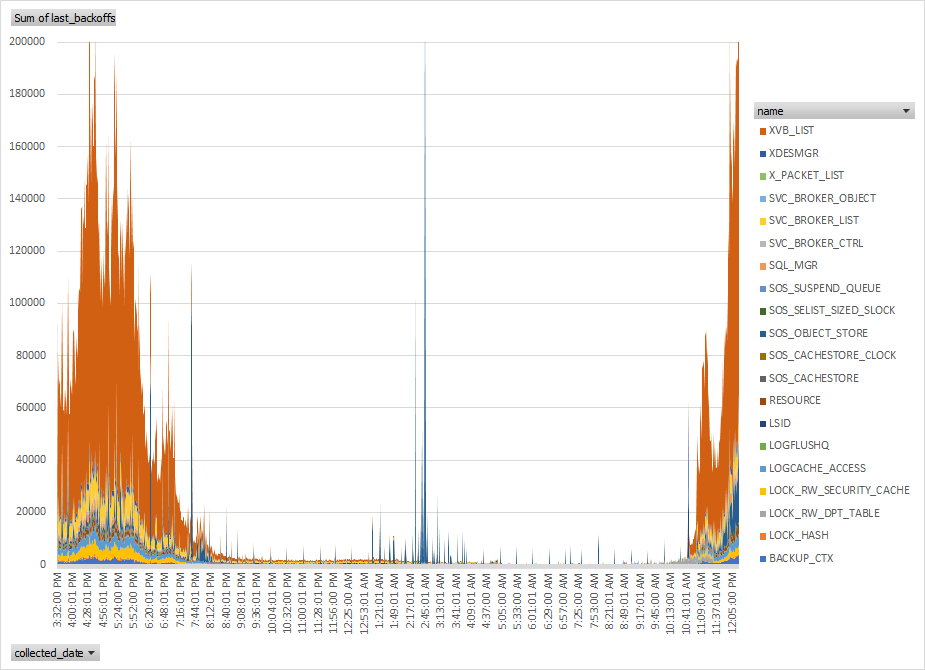
For example, here’s a chart I made when we were experiencing the XVB_LIST spinlock issues I wrote about not too long ago. Good visualizations can really tell powerful stories.

I’m talking here about spins and not waits of course, but the idea is the same and I’ve included the spinlock monitoring scripts in the same repo on github.
Also a quick reminder wait stats aren’t everything. Don’t neglect monitoring resources as Greg Gonzales pointed out last year.


[…] Michael J. Swart has a repo for us: […]
Pingback by Collecting Wait Stats Over Time – Curated SQL — January 11, 2021 @ 8:00 am
Great post! I can’t wait to try this. Our shop is small so that a SQL Server monitoring tool is not cost-effective. I have to resort to manual methods.
Can you point me to documentation that shows how to establish a PowerBI report for this data?
Thanks!
Comment by Robert Plata — January 15, 2021 @ 10:58 am
Thanks Robert.
I haven’t played around with PowerBI too much, but I have seen the things it can do.
I know there are resources out there, but I can’t recommend any with confidence because I haven’t really tried them out.
Maybe start with “What is PowerBI?”
Comment by Michael J. Swart — January 15, 2021 @ 1:00 pm
[…] useful, but are often underwhelming unless you’re watching at the right time, or you have a monitoring tool that logs them for you. Bottlenecks can live in many places, and oftentimes performance tuning is like playing […]
Pingback by Performance Measures And Factors | Erik Darling Data — January 26, 2021 @ 12:58 am
Appreciate you putting this article and tool together! Am glad Brent Ozar turned me onto your blog.
Comment by Sean Krause — January 28, 2021 @ 1:29 pm