My friend Josh came up with the term “dark queries”. Just like “dark matter”, dark queries can’t be detected directly, but their effect can still be observed. He’s talking about queries that aren’t stored in cache. If your monitoring solution relies heavily on the statistics of cached queries, then you may not be capturing all the activity on your server.

Some of my favorite monitoring solutions rely on the cached queries:
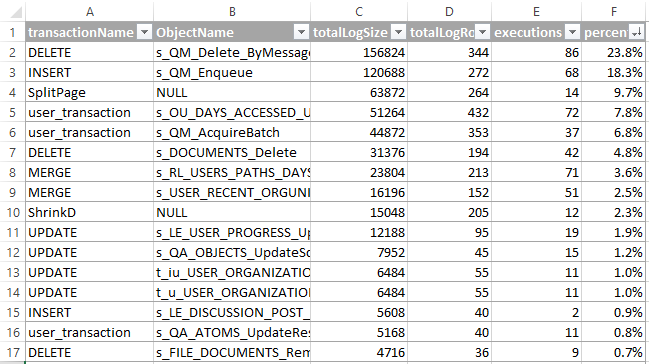
- My own top 20 queries at https://michaeljswart.com/go/top20
- sp_blitzcache
- etc…
but some queries will fall out of cache or don’t ever make it into cache. Those are the dark queries I’m interested in today. Today let’s look at query recompiles to shed light on some of those dark queries that maybe we’re not measuring.
By the way, if you’re using SQL Server 2016’s query store then this post isn’t for you because Query Store is awesome. Query Store doesn’t rely on the cache. It captures all activity and stores queries separately – Truth in advertising!
High Recompile Rate?
If you work with a high-frequency transactional workload like I do, then you can’t afford the CPU required for frequent recompiles. If you have sustained recompiles larger than a few hundred per second, that’s probably too much. It’s easy to check. Use the performance monitor to take a look at the SQL Re-Compilations/sec counter which is found in SQLServer:SQL Statistics/sec.

Drill Into Recompile Causes
You can drill into this a little further with an extended event session stored to a histogram like this:
CREATE EVENT SESSION Recompile_Histogram ON SERVER ADD EVENT sqlserver.sql_statement_recompile ADD TARGET package0.histogram ( SET filtering_event_name=N'sqlserver.sql_statement_recompile', source=N'recompile_cause', source_type=(0) ); ALTER EVENT SESSION Recompile_Histogram ON SERVER STATE = START; |
Query it like this
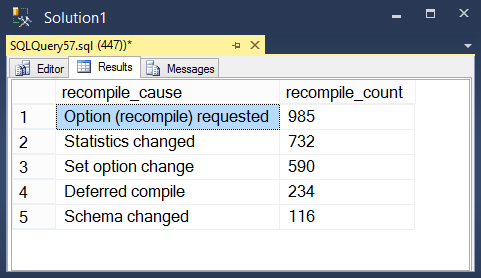
SELECT sv.subclass_name as recompile_cause, shredded.recompile_count FROM sys.dm_xe_session_targets AS xet JOIN sys.dm_xe_sessions AS xe ON (xe.address = xet.event_session_address) CROSS APPLY ( SELECT CAST(xet.target_data as xml) ) as target_data_xml ([xml]) CROSS APPLY target_data_xml.[xml].nodes('/HistogramTarget/Slot') AS nodes (slot_data) CROSS APPLY ( SELECT nodes.slot_data.value('(value)[1]', 'int') AS recompile_cause, nodes.slot_data.value('(@count)[1]', 'int') AS recompile_count ) as shredded JOIN sys.trace_subclass_values AS sv ON shredded.recompile_cause = sv.subclass_value WHERE xe.name = 'Recompile_Histogram' AND sv.trace_event_id = 37 -- SP:Recompile |
To get results like this:
Infrequent Recompiles?
Even if you don’t have frequent recompiles, it’s important to know what’s going on in the server. On your OLTP database, I bet you’re reluctant to let those BI folks run their analytical queries whenever they want. They may try to hide their shenanigans with an OPTION(RECOMPILE) hint. This extended events captures those query recompiles. Be sure to only capture a small sample by having the session run for a small amount of time. Or you can use the histogram above to make sure that the frequency is low.
CREATE EVENT SESSION [DarkQueries] ON SERVER ADD EVENT sqlserver.sql_statement_recompile( ACTION(sqlserver.database_id,sqlserver.sql_text) WHERE ([recompile_cause]=(11))) -- Option (RECOMPILE) Requested ADD TARGET package0.event_file(SET filename=N'DarkQueries'); ALTER EVENT SESSION [DarkQueries] ON SERVER STATE = START; GO |
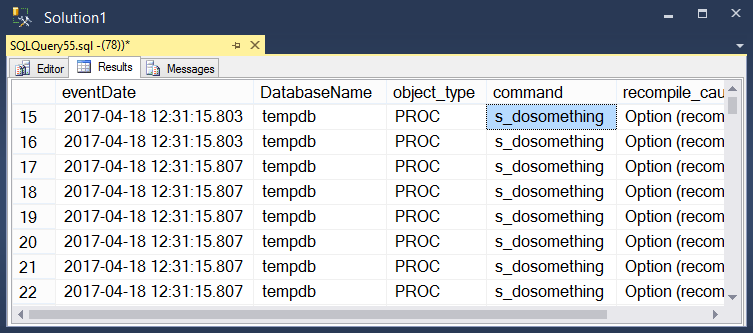
Take a look at the dark queries by executing this:
SELECT DarkQueryData.eventDate, DB_NAME(DarkQueryData.database_id) as DatabaseName, DarkQueryData.object_type, COALESCE(DarkQueryData.sql_text, OBJECT_NAME(DarkQueryData.object_id, DarkQueryData.database_id)) command, DarkQueryData.recompile_cause FROM sys.fn_xe_file_target_read_file ( 'DarkQueries*xel', null, null, null) event_file_value CROSS APPLY ( SELECT CAST(event_file_value.[event_data] as xml) ) event_file_value_xml ([xml]) CROSS APPLY ( SELECT event_file_value_xml.[xml].value('(event/@timestamp)[1]', 'datetime') as eventDate, event_file_value_xml.[xml].value('(event/action[@name="sql_text"]/value)[1]', 'nvarchar(max)') as sql_text, event_file_value_xml.[xml].value('(event/data[@name="object_type"]/text)[1]', 'nvarchar(100)') as object_type, event_file_value_xml.[xml].value('(event/data[@name="object_id"]/value)[1]', 'bigint') as object_id, event_file_value_xml.[xml].value('(event/data[@name="source_database_id"]/value)[1]', 'bigint') as database_id, event_file_value_xml.[xml].value('(event/data[@name="recompile_cause"]/text)[1]', 'nvarchar(100)') as recompile_cause ) as DarkQueryData ORDER BY eventDate DESC |
This gives you results that look something like the following contrived example: