I like rowversion columns, I like that they’re system-maintained and they provide a unique deterministic way to compare or order changes in a database. But they’re not timestamps (despite the alias).
I also like datetime2 columns which are called LastModifiedDate. They can indicate the date and time that a row was last modified. But I have to take care of maintaining the column myself. I either have to remember to update that column on every update or I have to use something like a trigger with the associated overhead.
But maybe there’s another option.
GENERATED ALWAYS AS ROW START
What if I use the columns that were meant to be used for temporal tables, but leave SYSTEM_VERSIONING off?
CREATETABLE dbo.Test(
Id INTIDENTITYNOTNULL,
ValueVARCHAR(100)NOTNULL,
LastModifiedDate DATETIME2 GENERATED ALWAYS ASROWSTARTNOTNULL,
SysEndTime DATETIME2 GENERATED ALWAYS ASROWEND HIDDEN NOTNULL,
PERIOD FOR SYSTEM_TIME (LastModifiedDate, SysEndTime),
CONSTRAINT PK_Test PRIMARYKEYCLUSTERED(Id))
CREATE TABLE dbo.Test
(
	Id INT IDENTITY NOT NULL,
	Value VARCHAR(100) NOT NULL,
	LastModifiedDate DATETIME2 GENERATED ALWAYS AS ROW START NOT NULL,
	SysEndTime DATETIME2 GENERATED ALWAYS AS ROW END HIDDEN NOT NULL,
	PERIOD FOR SYSTEM_TIME (LastModifiedDate, SysEndTime),
	CONSTRAINT PK_Test PRIMARY KEY CLUSTERED (Id)
)
It’s system maintained, it’s an actual datetime and I don’t have to worry about the overhead of triggers.
But it’s not a perfect solution:
SysEndTime is required but it’s an unused column here. It’s needed to define the period for SYSTEM_TIME and it’s always going to be DATETIME2’s maximum value. That’s why I made that column “hidden”. It’s got an overhead of 8 Bytes per row.
The value for LastModifiedDate will be the starting time of the transaction that last modified the row. That might lead to confusing behaviors illustrated by this example. Say that:
Transaction A starts
Transaction B starts
Transaction B modifies a row
Transaction A modifies the same row
After all that, the last modified date will indicate the time that transaction A starts. In fact if I try these shenanigans with system versioning turned on, I get this error message when transaction A tries to modify the same row:
Msg 13535, Level 16, State 0, Line 16
Data modification failed on system-versioned table ‘MyDb.dbo.Test’ because transaction time was earlier than period start time for affected records.
Everything is tradeoffs. If you can live with the drawbacks of the system-generated last modified date column, then it might be an option worth considering.
I have trouble with procedures that use SELECT *. They are often not “Blue-Green safe“. In other words, if a procedure has a query that uses SELECT * then I can’t change the underlying tables can’t change without causing some tricky deployment issues. (The same is not true for ad hoc queries from the application).
I also have a lot of procedures to look at (about 5000) and I’d like to find the procedures that use SELECT *.
I want to maybe ignore SELECT * when selecting from a subquery with a well-defined column list.
I also want to maybe include related queries like OUTPUT inserted.*.
The Plan
So I’m going to make a schema-only copy of the database to work with.
I’m going to add a new dummy-column to every single table.
I’m going to use sys.dm_exec_describe_first_result_set_for_object to look for any of the new columns I created
Any of my new columns that show up, were selected with SELECT *.
The Script
use master;
DROPDATABASEIFEXISTS search_for_select_star;
DBCC CLONEDATABASE (the_name_of_the_database_you_want_to_analyze, search_for_select_star);
ALTERDATABASE search_for_select_star SET READ_WRITE;
GO
use search_for_select_star;
DECLARE @SQLNVARCHAR(MAX);
SELECT
@SQL= STRING_AGG(CAST('ALTER TABLE '+QUOTENAME(OBJECT_SCHEMA_NAME(object_id))+'.'+QUOTENAME(OBJECT_NAME(object_id))+' ADD NewDummyColumn BIT NULL'ASNVARCHAR(MAX)),
N';')FROM
sys.tables;
execsp_executesql @SQL;
SELECT
SCHEMA_NAME(p.schema_id)+'.'+ p.nameAS procedure_name,
r.column_ordinal,
r.nameFROM
sys.procedures p
CROSS APPLY
sys.dm_exec_describe_first_result_set_for_object(p.object_id, NULL) r
WHERE
r.name='NewDummyColumn'ORDERBY
p.schema_id, p.name;
use master;
DROPDATABASEIFEXISTS search_for_select_star;
use master;
DROP DATABASE IF EXISTS search_for_select_star;
DBCC CLONEDATABASE (the_name_of_the_database_you_want_to_analyze, search_for_select_star);
ALTER DATABASE search_for_select_star SET READ_WRITE;
GO

use search_for_select_star;

DECLARE @SQL NVARCHAR(MAX);
SELECT
	@SQL = STRING_AGG(
		CAST(
			'ALTER TABLE ' +
			QUOTENAME(OBJECT_SCHEMA_NAME(object_id)) +
			'.' +
			QUOTENAME(OBJECT_NAME(object_id)) +
			' ADD NewDummyColumn BIT NULL' AS NVARCHAR(MAX)),
		N';')
FROM
	sys.tables;

exec sp_executesql @SQL;

SELECT
	SCHEMA_NAME(p.schema_id) + '.' + p.name AS procedure_name,
	r.column_ordinal,
	r.name
FROM
	sys.procedures p
CROSS APPLY
	sys.dm_exec_describe_first_result_set_for_object(p.object_id, NULL) r
WHERE
	r.name = 'NewDummyColumn'
ORDER BY
	p.schema_id, p.name;

use master;
DROP DATABASE IF EXISTS search_for_select_star;
Update
Tom from StraightforwardSQL pointed out a nifty feature that Microsoft has already implemented.
Not sure here, but doesn't dm_sql_referenced_entities.is_select_all achieve the same thing?
selectdistinct SCHEMA_NAME(p.schema_id)+'.'+ p.nameAS procedure_name
from sys.procedures p
cross apply sys.dm_sql_referenced_entities(
object_schema_name(object_id)+'.'+object_name(object_id), default) re
where re.is_select_all=1
select distinct SCHEMA_NAME(p.schema_id) + '.' + p.name AS procedure_name
from sys.procedures p
cross apply sys.dm_sql_referenced_entities(
	object_schema_name(object_id) + '.' + object_name(object_id), default) re
where re.is_select_all = 1
Comparing the two, I noticed that my query – the one that uses dm_exec_describe_first_result_set_for_object – has some drawbacks. Maybe the SELECT * isn’t actually included in the first result set, but some subsequent result set. Or maybe the result set couldn’t be described for one of these various reasons
On the other hand, I noticed that dm_sql_referenced_entities has a couple drawbacks itself. It doesn’t seem to capture select statements that use `OUTPUT INSERTED.*` for example.
In practice though, I found the query that Tom suggested works a bit better. In the product I work most closely with, dm_sql_referenced_entities only missed 3 procedures that dm_exec_describe_first_result_set_for_object caught. But dm_exec_describe_first_result_set_for_object missed 49 procedures that dm_sql_referenced_entities caught!
Aaron Bertrand has a post called Use Caution with SQL Server’s MERGE Statement. It’s a pretty thorough compilation of all the problems and defects associated with the MERGE statement that folks have reported in the past. But it’s been a few years since that post and in the spirit of giving Microsoft the benefit of the doubt, I revisited each of the issues Aaron brought up.
Some of the items can be dismissed based on circumstances. I noticed that:
Some of the issues are fixed in recent versions (2016+).
Some of the issues that have been marked as won’t fix have been fixed anyway (the repro script associated with the issue no longer fails).
Some of the items are complaints about confusing documentation.
Some are complaints are about issues that are not limited to the MERGE statement (e.g. concurrency and constraint checks).
So what about the rest? In what circumstances might I decide to use a MERGE statement? What do I still need to avoid? In 2019 and later, if I’m using MERGE, I want to avoid:
It’s a shorter list than Aaron’s but there’s another gotcha. The same way that some of the items get addressed with time, new issues continue to pop up. For example, temporal tables are a relatively new feature that weren’t a thing when Aaron’s first posted his list. And so I also want to avoid:
If MERGE has trouble with old and new features , then it becomes clear that MERGE is a very complicated beast to implement. It’s not an isolated feature and it multiplies the number of defects that are possible.
Severity of Issues
There’s a large number of issues with a large variety of severity. Some of the issues are minor annoyances, or easily avoidable. Some of them are serious performance issues that are harder to deal with. But a few of the issues can be worse than that! If I ask SQL Server to UPDATE something, and SQL Server responds with (1 row affected) , then it better have affected that row! If it didn’t, then that’s a whole new level of severity.
That leads me to what I think is the worst, unfixed bug. To be safe from it, avoid MERGEs with:
The defect is called Merge statement Delete does not update indexed view in all cases. It’s still active as of SQL Server 2019 CU9 and it leaves your indexed view inconsistent with the underlying tables. For my case, I can’t predict what indexed views would be created in the future, so I would shorten my advice to say avoid MERGEs with:
When I first started writing this post, I thought the gist was going to be “MERGE isn’t so bad if you just avoid these things”. But it still is bad. Aaron’s list is a little out of date but his advice is not. If Aaron updated that post today, the list of defects and issues with MERGE would be different and just as concerning to me as the day he wrote it.
Takeaway: For most use cases, using sp_releaseapplock is unnecessary. Especially when using @LockOwner = 'Transaction (which is the default).
The procedure sp_getapplock is a system stored procedure that can be helpful when developing SQL for concurrency. It takes a lock on an imaginary resource and it can be used to avoid race conditions.
But I don’t use sp_getapplock a lot. I almost always depend on SQL Server’s normal locking of resources (like tables, indexes, rows etc…). But I might consider it for complicated situations (like managing sort order in a hierarchy using a table with many different indexes).
But there’s a problem with this pattern, especially when using RCSI. After sp_releaseapplock is called, but before the COMMIT completes, another process running the same code can read the previous state. In the example above, both processes will think a time slot is available and will try to make the same reservation.
What I really want is to release the applock after the commit. But because I specified the lock owner is 'Transaction'. That gets done automatically when the transaction ends! So really what I want is this:
BEGINTRANexecsp_getapplock
@Resource = @LockResourceName,
@LockMode ='Exclusive',
@LockOwner ='Transaction';
/* read stuff (e.g. "is time slot available?") *//* change stuff (e.g. "make reservation") */COMMIT-- all locks are freed after this commit
BEGIN TRAN

exec sp_getapplock
    @Resource = @LockResourceName,
    @LockMode = 'Exclusive',
    @LockOwner = 'Transaction';

/* read stuff (e.g. "is time slot available?") */
/* change stuff (e.g. "make reservation") */

COMMIT -- all locks are freed after this commit
I sometimes get frustrated with SQL Server. It’s a tricky and challenging product to work with and some days I feel like I’ve only scratched the surface.
But sometimes I’m really impressed with what it can do. It really is a good (if expensive) product.
With the increase in online learning, last week we broke a record for a single SQL Server. 254,000 batch requests per second! That’s the first time we’ve pushed it above the quarter million mark.
(The screen shot was from a day earlier, but you get the idea)
I’d like to hear from others that have reached these kinds of numbers in prod to talk about their experiences. Find me on twitter (@MJSwart).
Find Out More About Our Experience
I’ll be presenting to the Ohio North User Group this February 2nd called How High Can We Scale SQL Server? Feel free to sign up!
I have fond memories of presenting to folks in Cleveland. Why they host their SQL Saturday’s in February is still a mystery. And so I’m glad to present virtually this February to keep up my streak.
But that gives the total amount of waits for each wait type accumulated since the server was started. And that isn’t ideal when I’m troubleshooting trouble that started recently. No worries, Paul also has another fantastic post Capturing wait statistics for a period of time.
Taking that idea further, I can collect data all the time and look at it historically, or just for a baseline. Lot’s of monitoring tools do this already, but here’s what I’ve written:
Mostly I’m creating these scripts for me. I’ve created a version of these a few times now and some reason, I can’t find them each time I need them again!
This stuff can be super useful, especially, if you combine it with a visualization tool (like PowerBI or even Excel).
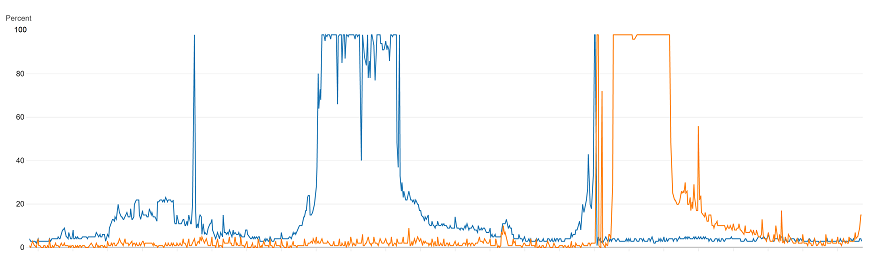
For example, here’s a chart I made when we were experiencing the XVB_LIST spinlock issues I wrote about not too long ago. Good visualizations can really tell powerful stories.
I’m talking here about spins and not waits of course, but the idea is the same and I’ve included the spinlock monitoring scripts in the same repo on github.
Scaling SQL Server High
The beginning of the school year is behind us and what a semester start! 2020 has been tough on many of us and I’m fortunate to work for a company whose services are in such high demand. In fact we’ve seen some scaling challenges like we’ve never seen before. I want to talk about some of them.
Detect Excessive Spinlock Contention on SQL Server
Context
As we prepared to face unprecedented demand this year, we began to think about whether bigger is better. Worried about CPU limits, we looked to what AWS had to offer in terms of their instance sizes.
We were already running our largest SQL Servers on r5 instances with 96 logical CPUs. But we decided to evaluate the pricy u instances which have 448 logical CPUs and a huge amount of memory.
Painful Symptoms
Well, bigger is not always better. We discovered that as we increased the load on the u-series servers, there would come a point where all processors would jump to 100% and stayed there. You could say it plateaued (based on the graph, would that be a plateau? A mesa? Or a butte?)
When that occurred, the number of batch requests that the server could handle dropped significantly. So we saw more CPU use, but less work was getting done.
The high demand kept the CPU at 100% with no relief until the demand decreased. When that happened, the database seemed to recover. Throughput was restored and the database’s metrics became healthy again. During this trouble we looked at everything including the number of spins reported in the sys.dm_os_spinlock_stats dmv.
The spins and backoffs reported seemed extremely high, especially for the category “XVB_LIST”, but we didn’t really have a baseline to tell whether those numbers were problematic. Even after capturing the numbers and visualizing them we saw larger than linear increases as demand increased, but were those increases excessive?
How To Tell For Sure
Chris Adkin has a post Diagnosing Spinlock Problems By Doing The Math. He explains why spinlocks are useful. It doesn’t seem like a while loop that chews up CPU could improve performance, but it actually does when it helps avoid context switches. He gives a formula to help find how much of the total CPU is spent spinning. That percentage can then help decide whether the spinning is excessive.
But I made a tiny tweak to his formula and I wrote a script to have SQL Server do the math:
You still have to give the number of CPUs on your server. If you don’t have those numbers handy, you can get them from SQL Server’s log. I include one of Glenn Berry’s diagnostic queries for that.
There’s an assumption in Chris’s calculation that one spin consumes one CPU clock cycle. A spin is really cheap (because it can use the test-and-set instruction), but it probably consumes more than one clock cycle. I assume four, but I have no idea what the actual value is.
EXEC sys.xp_readerrorlog 0, 1, N'detected', N'socket';
-- SQL Server detected 2 sockets with 24 cores per socket ...
declare @Sockets int = 2;
declare @PhysicalCoresPerSocket int = 24;
declare @TicksPerSpin int = 4;
declare @SpinlockSnapshot TABLE (
SpinLockName VARCHAR(100),
SpinTotal BIGINT
);
INSERT @SpinlockSnapshot ( SpinLockName, SpinTotal )
SELECT name, spins
FROM sys.dm_os_spinlock_stats
WHERE spins > 0;
DECLARE @Ticks bigint
SELECT @Ticks = cpu_ticks
FROM sys.dm_os_sys_info
WAITFOR DELAY '00:00:10'
DECLARE @TotalTicksInInterval BIGINT
DECLARE @CPU_GHz NUMERIC(20, 2);
SELECT @TotalTicksInInterval = (cpu_ticks - @Ticks) * @Sockets * @PhysicalCoresPerSocket,
@CPU_GHz = ( cpu_ticks - @Ticks ) / 10000000000.0
FROM sys.dm_os_sys_info;
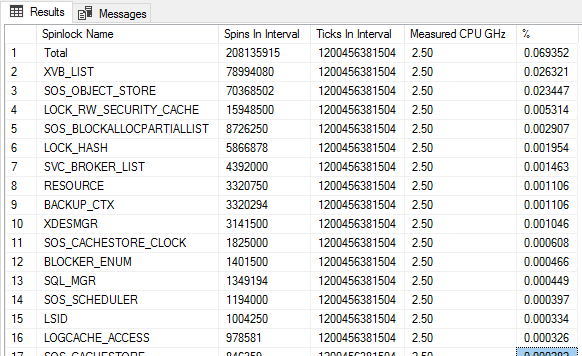
SELECT ISNULL(Snap.SpinLockName, 'Total') as [Spinlock Name],
SUM(Stat.spins - Snap.SpinTotal) as [Spins In Interval],
@TotalTicksInInterval as [Ticks In Interval],
@CPU_Ghz as [Measured CPU GHz],
100.0 * SUM(Stat.spins - Snap.SpinTotal) * @TicksPerSpin / @TotalTicksInInterval as [%]
FROM @SpinlockSnapshot Snap
JOIN sys.dm_os_spinlock_stats Stat
ON Snap.SpinLockName = Stat.name
GROUP BY ROLLUP (Snap.SpinLockName)
HAVING SUM(Stat.spins - Snap.SpinTotal) > 0
ORDER BY [Spins In Interval] DESC;
This is what I see on a very healthy server (r5.24xlarge). The server was using 14% cpu. And .03% of that is spent spinning (or somewhere in that ballpark).
More Troubleshooting Steps
So what’s going on? What is that XVB_LIST category? Microsoft says “internal use only” But I can guess. Paul Randal talks about the related latch class Versioning Transaction List. It’s an instance-wide list that is used in the implementation of features like Read Committed Snapshot Isolation (RCSI) which we do use.
Microsoft also has a whitepaper on troubleshooting this stuff Diagnose and resolve spinlock contention on SQL Server. They actually give a technique to collect call stacks during spinlock contention in order to try and maybe glean some information about what else is going on. We did that, but we didn’t learn too much. We learned that we use RCSI with lots of concurrent queries. Something we really can’t give up on.
So Then What?
What We Did
Well, we moved away from the u instance with its hundreds of CPUs and we went back to our r5 instance with only (only!) 96 logical CPUs. We’re dealing with the limits imposed by that hardware and accepting that we can’t scale higher using that box. We’re continuing to do our darnedest to move data and activity out of SQL Server and into other solutions like DynamoDb. We’re also trying to partition our databases into different deployments which spreads the load out, but introduces a lot of other challenges.
Basically, we gave up trying to scale higher. If we did want to pursue this further (which we don’t), we’d probably contact Microsoft support to try and address this spinlock contention. We know that these conditions are sufficient (if not necessary) to see the contention we saw:
SQL Server 2016 SP2
U-series instance from Amazon
Highly concurrent and frequent queries (>200K batch requests per second with a good mix of writes and reads on the same tables)
RCSI enabled.
Thank you Erin Stellato
We reached out to Erin Stellato to help us through this issue. We did this sometime around the “Painful Symptoms” section above. We had a stressful time troubleshooting all this stuff and I really appreciate Erin guiding us through it. We learned so much.
Scaling SQL Server High
The beginning of the school year is behind us and what a semester start! 2020 has been tough on many of us and I’m fortunate to work for a company whose services are in such high demand. In fact we’ve seen some scaling challenges like we’ve never seen before. I want to talk about some of them.
It’s been a whirlwind of a month. The first day of school, or a new semester is always a busy time for online education. And in 2020 that’s an understatement. This year, we had to answer how busy could one SQL Server get?
We’ve always approached this question using the usual techniques
Cache like crazy (the cheapest query is the one that doesn’t have to be run)
Tackle expensive queries (CPU, IO)
Tackle large wait categories (so much easier said than done)
Offload reporting queries to other servers.
This year we smashed records and faced some interesting challenges along the way. I want to talk about those challenges in the next few blog posts. This first post is about user connections. Something I’ve never really paid much attention to before now.
A Metric I’d Never Thought I’d Have To Worry About
The maximum number of user connections that SQL Server can support is 32,767. That’s it. That’s the end of the line. You can buy faster I.O. or a server with more CPUs but you can’t buy more connections.
With such a hard limit, it’s important to watch this metric carefully. You can do that with the performance counter SQLServer: General Statistics – User Connections or with this query:
SELECT ISNULL(DB_NAME(database_id), 'Total On Server')AS DatabaseName,
COUNT(*)AS Connections,
COUNT(DISTINCThost_name) ClientMachines
FROM sys.dm_exec_sessionsWHEREhost_nameISNOTNULLGROUPBYROLLUP( database_id )
SELECT   ISNULL(DB_NAME(database_id), 'Total On Server') AS DatabaseName,
         COUNT(*) AS Connections,
         COUNT(DISTINCT host_name) ClientMachines
FROM     sys.dm_exec_sessions
WHERE    host_name IS NOT NULL
GROUP BY ROLLUP( database_id )
The Maximum is 32,767
If you haven’t changed the maximum number of user connections by some method like sp_configure 'user connections', then the default is 0 and @@MAX_CONNECTIONS will return 32,767. I think the UI for this property is a bit misleading, 0 is absolutely not equivalent to unlimited.
What Does Trouble Look Like?
The issue shows up on the client when it’s unable to establish a connection to the server. There’s a variety of errors you might see such as:
Client unable to establish connection because an error was encountered during handshakes before login. Common causes include client attempting to connect to an unsupported version of SQL Server, server too busy to accept new connections or a resource limitation (memory or maximum allowed connections) on the server.
A connection was successfully established with the server, but then an error occurred during the pre-login handshake. (provider: TCP Provider, error: 0 – An existing connection was forcibly closed by the remote host.)
Or simply the generic:
A network-related or instance-specific error occurred while establishing a connection to SQL Server. The server was not found or was not accessible. Verify that the instance name is correct and that SQL Server is configured to allow remote connections. (provider: TCP Provider, error: 40 – Could not open a connection to SQL Server)
It’s Almost Always a Symptom
It’s often a symptom and not the root cause. For example, imagine you have a busy server with lots of clients and there’s a sudden slowdown.
Perhaps the slowdown is an increase in a certain wait category like blocking (LCK_M_X) or perhaps the slowdown is an increase in CPU because of a bad query plan. Either way, queries suddenly require a longer duration. They can’t complete quickly and remain open. So any new queries that come along have to make brand new connections (because there are no available connections in the connection pool). Maybe THREADPOOL waits start to pile up. And now even more sessions are waiting and more sessions get created. Then you might reach the maximum number of connections in this scenario.
But decent monitoring will often identify the actual root cause here (the blocking or whatever). And it’s actually easy to ignore the user connection limit because it wasn’t really the bottleneck.
But Sometimes it’s the Root Cause
Once we’ve tackled all the other scaling challenges, and the demand gets cranked up to 11. Then we can see trouble.
In our case. We have an elastic scaling policy that allows us to spin up client machines in response to demand. So hundreds of web servers times the number connection pools times the number of connections in each pool can really add up fast. So those web servers scale really nicely, but without a decent sharding strategy, SQL Server doesn’t.
On one of our servers, this is where we’re sitting now, and the number of connections is uncomfortably high. There’s not a lot of room to tolerate bursts of extra activity here:
The red lines indicate 10% and 100% of the maximum connection count.
What We Can Do About It
Monitor the number of connections that is typical for your servers using the query above for a point in time. Or use the performance counter: SQLServer: General Statistics – User Connections
Make sure you’re not leaking any connections. This SQLPerformance post tells you how to find that.
Use connection pooling efficiently. This Microsoft article SQL Server Connection Pooling (ADO.NET) has some great tips on avoiding pool fragmentation. The article describes pool fragmentation as a web server issue. But the tips are also appropriate to minimizing the total user connections on the server.
Keep the variety of connection strings used by your application small. With connection pooling, connections are only made when they’re needed. But still there’s a little bit of overhead. It takes 4 to 8 minutes for an idle connection to be released by the pool. So minimizing the number of connection pools actually does help.
Queries should be as quick as possible. Get in and out.
Offload reads as much as possible to other servers. Availability groups have read-only routing features but be careful how you implement this. If you have some connection strings that use ApplicationIntent=ReadOnly and some that don’t, then that’s two different connection pools. If you want to defer configuring AGs until after the connection strings are done, then there can be some tricky overlapping scenarios. It’s complicated, and it just highlights the importance of monitoring.
When tuning queries. The metric to focus on is the total duration of queries. Try to minimize that number. That’s the total_elapsed_time column in sys.dm_exec_query_stats. Or the elapsed time query in http://michaeljswart.com/go/top20. This is an interesting one. I’ve always preferred to focus on optimizing CPU or logical reads. But in this case, connection count is most sensitive to long running queries no matter the reason.
I’d love to hear about others who have tackled this problem. Let me know what strategies you came up with.
database table’s auto-incrementing ID column exceeded [maxint]. When we attempted to insert larger integers into the column, the database rejected the value
This led to a discussion about setting up monitoring for this kind of problem in our software. We have a place for monitoring and health-checks for all our databases. We just need to know how to define them.
So how do I create a script that reports any tables whose current identity values are above a certain threshold? This is what I came up with. Maybe you’ll find it useful too.
Find Tables in SQL Server Running Out Of Identity Room
declare @percentThreshold int=70;
select t.nameas[table],
c.nameas[column],
ty.nameas[type],
IDENT_CURRENT(t.name)as[identity],
100*IDENT_CURRENT(t.name)/2147483647as[percentfull]from sys.tables t
join sys.columns c
on c.object_id= t.object_idjoin sys.types ty
on ty.system_type_id= c.system_type_idwhere c.is_identity=1and ty.name='int'and100*IDENT_CURRENT(t.name)/2147483647> @percentThreshold
orderby t.name
declare @percentThreshold int = 70;

select t.name as [table],
       c.name as [column],
       ty.name as [type],
       IDENT_CURRENT(t.name) as [identity],
       100 * IDENT_CURRENT(t.name) / 2147483647 as [percent full]
from   sys.tables t
join   sys.columns c
       on c.object_id = t.object_id
join   sys.types ty
       on ty.system_type_id = c.system_type_id
where  c.is_identity = 1
and    ty.name = 'int'
and    100 * IDENT_CURRENT(t.name) / 2147483647 > @percentThreshold
order  by t.name
Other Notes
I really prefer sequences for this kind of thing. Monitoring goes along similar lines
I only worry about ints. Bigints are just too big.
I was looking at the docs for DROP TABLE and I noticed this in the syntax: [ ,...n ]. I never realized that you can drop more than one table in a statement.
You Still Have to Care About Order
I think that’s great. When dropping tables one at a time. You always had to be careful about order when foreign keys were involved. Alas, you still have to care about order. The docs say:
If both the referencing table and the table that holds the primary key are being dropped in the same DROP TABLE statement, the referencing table must be listed first.
That means that when you run
CREATETABLE A ( id INTPRIMARYKEY);
CREATETABLE B ( id INTFOREIGNKEYREFERENCES A(id));
DROPTABLEIFEXISTS A, B;
CREATE TABLE A ( id INT PRIMARY KEY );
CREATE TABLE B ( id INT FOREIGN KEY REFERENCES A(id) );

DROP TABLE IF EXISTS A, B;
It fails with
Msg 3726, Level 16, State 1, Line 4
Could not drop object ‘A’ because it is referenced by a FOREIGN KEY constraint.
This is a suggestion made by Matt Smith. Currently DROP TABLE behaves this way:
DROP TABLE IF EXISTS succeeds if the table exists and is deleted.
DROP TABLE IF EXISTS succeeds when there is no object with that name.
DROP TABLE IF EXISTS fails when that object name refers to an object that is not a table
For example, this script
CREATEVIEW C ASSELECT1AS One;
go
DROPTABLEIFEXISTS C;
CREATE VIEW C AS SELECT 1 AS One;
go
DROP TABLE IF EXISTS C;
gives the error
Msg 3705, Level 16, State 1, Line 9
Cannot use DROP TABLE with ‘C’ because ‘C’ is a view. Use DROP VIEW.
It’s really not in the spirit of what was intended with “IF EXISTS”. If you want to vote for that suggestion, it’s here DROP TABLE IF EXISTS fails
DROP TABLE is not Atomic
I’ve gotten really used to relying on atomic transactions. I know that when I update a set of rows, I can rely on the fact that all of the rows are updated, or in the case of an error, none of the rows are updated. There’s no situation where some of the rows are updated. But a DROP TABLE statement that tries to drop multiple tables using the [ ,...n ] syntax doesn’t behave that way. If there’s an error, SQL Server continues with the list dropping the tables that it can.
We can see that with the first example. Here it is again:
CREATETABLE A ( id INTPRIMARYKEY);
CREATETABLE B ( id INTFOREIGNKEYREFERENCES A(id));
DROPTABLEIFEXISTS A, B;
-- Could not drop object 'A' because it is referenced by a FOREIGN KEY constraint.-- B is dropped
CREATE TABLE A ( id INT PRIMARY KEY );
CREATE TABLE B ( id INT FOREIGN KEY REFERENCES A(id) );

DROP TABLE IF EXISTS A, B;
-- Could not drop object 'A' because it is referenced by a FOREIGN KEY constraint.
-- B is dropped
That example throws an error and drops a table.
The same nonatomic behavior is seen in a simpler example:
CREATETABLE D ( id INT);
DROPTABLE E, D;
-- Invalid object name 'E'-- D is dropped
CREATE TABLE D ( id INT );

DROP TABLE E, D;
-- Invalid object name 'E'
-- D is dropped