Michael J. Swart

May 18, 2011

Okay, You’ve Found Blocking, Now What?

Takeaway: You’ve detected, analyzed and understood blocked processes that have happened on your machine. What can you do to avoid this blocking in the future?

Those who know me well, know I’ve started a project that helps database professionals analyze the blocked process reports that SQL Server produces. I’ve talked about it before:

Barry White endorses my software ... probably

What Next?

But I got an excellent comment from Wallace Houston. He writes:

“What I’m looking for is “what to do” when blocks are already identified.  I want to try to prevent them.  In other words, how to modify my code in such a way as to avoid as many blocks as possible.”

That’s an excellent question. Wallace went on to talk about a “chain reaction” of blocking where everything locked up. Man, I’ve been there and it can be disastrous. It sometimes seems like the only thing to do is to kill the lead blocker’s process. And that feels like giving up.

So after giving it some thought. I came up with this (slightly reworded from my reply to Wallace). These are actions you can take to avoid blocking in the future.

This is Next:

There’s a lot you can do to avoid excessive blocking. I’ve learned very recently that peoples’ ideas of excessive blocking vary a lot. In my environment, I look for blocking longer than 10 seconds. Other people watch for a threshold of 10 minutes!
Either way,
  • If at all possible, tune the lead blocker. If a lead blocker can get take its lock and let it go immediately then there’s no more blocking.
  • Avoid transactions if you don’t need them (but don’t be afraid of them if you do).
  • Pick the nicest isolation level for your transaction. Read committed is nicer than repeatable read is nicer than serializable.
  • If you can get away with it, maybe put the query that’s the lead blocker in a transaction that uses “snapshot isolation”. It uses a bit of tempdb resources, but it’s awesome for concurrency problems.
  • There’s table lock hints (readpast, nolock, holdlock) for more targeted locking, but really you want to understand who’s doing what before you go down that road.
  • I’m not ashamed to say that I’ve used isolation level “read uncommitted” which is equivalent to the NOLOCK table hint. Especially when the caller can tolerate the very very rare cases of inconsistency that might result. NOLOCK is easy and you can’t argue with results – it works – but snapshot isolation is preferred because it is guaranteed to be consistent (if not current).
I remember once I had a table, let’s call it  T whose columns a,b,c,d, and e got queried a lot. But column x got updated a lot and we had blocking issues. The solution was to split the table T into T1 (a,b,c,d,e) and T2(x) with a foreign key from T2 to T1. We then updated queries that used it and got seriously reduced contention.

Progress on my Blocked Process Report Viewer

And for those that are curious, my Blocked Process Report (BPR) Viewer is coming along nicely.

Lately I’ve

  • fixed a few bugs
  • added some documentation (which you’ve already seen if you read this blog).
  • added some SQL Profiler template files and SQL Trace scripts to help collect BPR
  • added a quick and dirty test suite.

It’s pretty much good to go and release as version 1.0. But I still want to add features that makes it easier to analyze.

Stay tuned and happy block busting!

May 4, 2011

When To Use Blocked Processes Reports

I introduced the SQL Server Blocked Process Report Viewer a couple weeks ago and I realize that I took something for granted. Not everyone has practice watching for Blocked Process Reports and not everyone understands how or when they can use my utility to help troubleshoot concurrency issues.

Steps For Finding Concurrency Problems

Remember: When it comes to concurrency problems, you don’t have to guess what’s wrong!!!

And I explain it flowchart style!

Wait Statistics Who Is Active SQL Trace SQL Server Blocked Process Report Viewer Event Notifications The Future – Tracking Blocking in Denali
  • Checking for LCK_M_XX waits Paul Randal has a great script that interprets the data in the dmv sys.dm_os_wait_stats. I like this script because when all else fails. This script is a great starting point for understanding where the system’s bottlenecks are.
  • Using sp_WhoIsActive Adam Machanic wrote Who Is Active as an tricked out version of sp_who and sp_who2. I recommend it because it is a great view into what’s active on your server right now. And that includes blocked processes and other concurrency issues. (i.e. For any acute problem go there. For chronic concurrency problems, come back here).
  • Using SQL Trace You might know this as Profiler. Capture a trace with the “Blocked Process Report” event which is located in the Error and Warnings event list. But don’t forget! You first have to decide on what it means for your system to have excessive blocking and configure the blocked process threshold accordingly. I’ve learned very recently that peoples’ ideas of excessive blocking vary a lot. In my own environment, I often look for blocking longer than 10 seconds. Other people use a threshold of 10 minutes!
  • Analyzing Traces With Blocked Process Report Viewer This is the tool I wrote that I hope you find useful. Right now it tells you who the lead blocker is. And I hope to expand the features into analysis soon.
  • Configuring Server for Event Notifications I’m really not too familiar with this option and don’t use it much. As an alternative you can also use WMI queries and events mapped to a sql agent job (Thanks Vincent Salard, for that tip).
  • Using Extended Events Once Denali Arrives Jonathan Kehayias knows extended events backwards and forwards. In his blog post here, he describes how in the next version of SQL Server, the blocked process report will be traceable using extended events.

An Ounce of Prevention

In an extremely timely post Kendra Little writes about understanding locks in It’s a Lock. Following much of the same steps, you can understand what your app is doing beforehand and avoid any blocking problems from the start (e.g. understanding locks held during schema changes).

Next Week

  • I’ll be releasing SQL Server Blocked Process Report Viewer. (Right now we’re only in beta and I’m also open to suggestions about a new name for the tool)
  • Understanding blocking is the first step. Next week I’ll talk about what happens after analysis. I’ll write about the steps I’ve taken and had success with. after analysis.

April 20, 2011

A New Way to Examine Blocked Process Reports

Solving concurrency problems are a large part of troubleshooting. Often solutions include tuning the blockers to minimize the blocked time or tweaking locks and isolation levels to make processes play nicely with each other. But to dig into the problem, you have to understand the blocking chain.

If you’re troubleshooting a concurrency problem that’s happening on your server right now then you can get information from the DMVs or even better, by using Adam Machanic’s Who Is Active stored procedure.

But what if the excessive blocking behavior is intermittent? Then the best strategy is to monitor the server and try to capture a SQL trace that includes the “blocked process report” event. I’ve had a lot of luck with that event, it can really tell you a story about excessive blocking. But I find that interpreting the trace can be tricky, especially when there’s a large blocking chain. Sorting through hundreds of events to find the lead blocker is not fun.

New and Free: sp_blocked_process_report_viewer

So I wrote a script! And I stuffed it in a stored procedure! Here’s the syntax (BOL-Style):
Syntax

sp_blocked_process_report_viewer [@Trace = ] 'TraceFileOrTable'
    [ , [ @Type = ] 'TraceType' ]

Arguments
[@Trace = ] ‘TraceFileOrTable’

    Is the name of the trace table or trace file that holds the blocked process reports

[@Trace = ] ‘TraceType’

    Is the type of file referenced by TraceFileOrTable. Values can be TABLE, FILE or XMLFILE. The default is FILE

Download it Now!

Go to the https://github.com/mjswart/sqlblockedprocesses site and download it. Once you’re there, click on the big green download button (as shown to the right) and you’ll have the stored procedure!

Here’s a sample output. It shows clearly who the lead blocker is:

A screenshot showing output for this sproc

Nicely organized, at least better than usual

I’m Promoting This Script to a Project

Although, you still have to know how to read a blocked process report, this utility makes the structure of the blocking chain clear. I find this script useful for my own purposes. In fact I like it enough that I’m going to maintain it on github as:  SQL Server Blocked Process Report Viewer

Let Me Know How It Goes

Run the script! Use it! Tell your friends. Tell me what you think of it (for once in my life, I’m seeking out criticism).

Going forward, I do have some plans for the script. There’s a number of things I eventually want to do with it:

  • Add error handling
  • Really make the sproc perform well (it’s already decent).
  • Develop a test suite (sample traces that exercise the procedure)
  • There’s an opportunity to look up object names, index names and sql text based on object ids if the traces belong to the local server.
  • A SQL Server Management Studio plugin. A treeview control would really be useful here. (This might be easier after Denali comes out)

I plan to do the work, but if you’re really keen and you want to pitch in, you’re welcome to. If you see any errors you can

September 10, 2009

View Blocked Process Reports using the Deadlock Graph Control

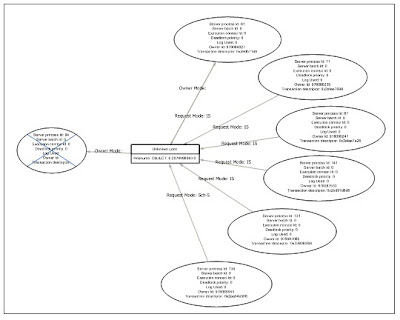
What am I looking at here?
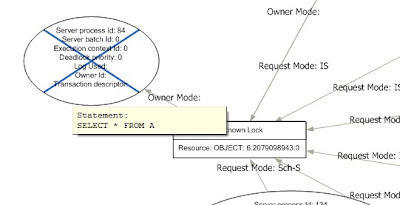
Shown above is a set of blocked process report. But it’s being displayed using SQL Server’s Deadlock Graph Control. Here’s a detail of the graph:
I’m totally wearing my hacker hat with this. Microsoft built the deadlock graph control to display deadlock graphs generated by Microsoft’s tools. What I’ve done is to take a set of blocked process reports and reformat them to look like a deadlock graph. You can tell that it’s not a deadlock because the graph is a tree, with no cycles.
See that process with the X through it. Normally it indicates a deadlock victim. But in this case, I’ve repurposed the X to indicate the lead blocker (i.e. the stalled car in the traffic jam of blocked SQL Servers).
Why?
The graph is useful because it can tell a story graphically that would otherwise take maybe 100 times longer to understand by reading the xml reports directly.
A few years ago when I installed SQL Server 2005 for the first time, I played around with SQL Server profiler and traces in general and had one of those moments that made me say “nifty!” I was looking at a deadlock graph displayed graphically.
Not much later after that, I noticed that blocked process reports contain information very similar to deadlock graphs. It wasn’t much of a leap to think that with a little creative reformatting, I could make the deadlock graph control do something else useful with blocked process reports.
How?
So here’s what you do:
  1. Find a trace that contains blocked processes reports. If it’s not already, save it as a table called blocked. The script below assumes that a table called blocked has already been created. (Alternatively, create an synonym called blocked that refers to a table)
  2. Copy the script below and run it in Management Studio.
  3. Click the blocking chain xml of interest to you.
  4. Save the xml file as an xdl file.
  5. Close and reopen the file in Management Studio.
The man behind the curtains.
So here’s the script I talked about. It’s also an example of me flexing my XML muscles.

Update Mar. 29, 2010 Due to the size of the script and some other formatting issues, I’m providing the script as a link rather than something to copy and paste. Download the script here.

September 8, 2009

Finding the Lead Blocker in a Set of Blocked Process Reports

Traffic jam by lynac on FlickrTakeaway: Skip to the end for a script that reports the lead blocker for a set of Blocked Process Reports. And tune in later this week for a nifty graphing trick for blocked process chains.

On Blocking
Sometimes SQL Server is like a highway, and is prone to traffic jams. Blocking processes (not to be confused with deadlocked processes) are processes that are waiting for resources that are being used by other processes.

Every now and then people talk about blocking chains. These are blocked processes that are waiting in a line. Process A is waiting for Process B. Process B is waiting for Process C. etc… In all cases, you want to find the lead blocker (the head of the chain) and address any issues that that process has. Think of the traffic jam analogy, it’s no good trying to focus on the Toyota that’s waiting patiently; you have to focus on the stalled Honda in the front.

I can think of two good ways to analyze blocking and blocking chains. The first method analyzes the current state of the database. The other focuses on collected trace data:

Method 1: Look at the current state of the database:
Look at the DMVs that are available, or at least to the sys.processes table. These tables provide data about the current state of the database. These tables have been discussed by Tim Chapman here and by Kalen Delaney here (Kalen’s script was written before 2005 but is still awesome). Or in short, try a variety of other solutions found here: http://www.lmgtfy.com/?q=sql+blocking.chain. I’m not going to add another solution with this post.

Method 2: Look at Blocked process report events in a trace:
Another method of analyzing blocking chains looks at data that is retrieved in one or more Blocked processes report. These Blocked process reports are generated and captured using a server-side trace or by using SQL Profiler. The blocked process report holds a ton of useful information. You can find a good example here (courtesy Johnathan Kehayias): http://jmkehayias.blogspot.com/2008/09/monitoring-for-blocked-processes-on-sql.html

Notice that there are two xml nodes under the blocked-process-report tag. These two refer to two processes, a blocked process and a blocking process (always two there are, no more, no less). So what happens if you have a blocking chain involving 12 processes? Then you’ll have 11 events in your trace. 11 blocked process reports with the same timestamp. This can make it tricky to find the lead blocker (the stalled Honda).

One way is to scan through the trace to find the process that’s been blocked the longest (the blocked process report with the largest duration). The blocking process is likely to be the lead blocker.

Or you can use this script:

WITH rankedEvents AS
(
   SELECT ROW_NUMBER() OVER (PARTITION BY EndTime ORDER BY Duration DESC) AS myRank ,
       CAST (TEXTData AS XML) AS TEXTdata
   FROM blocked
   WHERE EventClass = 137
)
SELECT TEXTdata
FROM rankedevents
WHERE myRank = 1

where blocked is the name of the table where SQL trace data is stored.

Later this week I plan to describe a method where I use SQL Server’s Deadlock Graph control to display blocking chains.

Powered by WordPress