


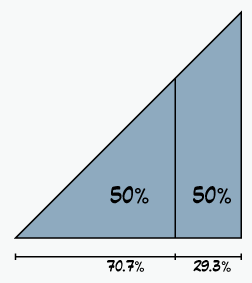
Using the right triangle above draw a vertical line separating the area of the triangle in to two parts with the same area.
The triangle on the left is 70.7% of the width of the original triangle.
Cumulative Storage Costs
Think of this another way. The triangle above is a graph of the amount of data you have over time. And if you pay for storage as an operational expense such as when you’re renting storage in the cloud (as opposed to purchasing physical drives). Then the cost of storage is the area of the graph. The monthly bills are ever-increasing, so half of the total cost of storage will be for the most recent 29%.
Put yet another way: If you started creating a large file in the cloud every day since March 2014, then the amount you paid to the cloud provider before the pandemic started is the same amount you paid after the pandemic started (as of August 2022).
How Sustainable is This?
If the amount of data generated a day isn’t that much, or the storage you’re using is cheap enough then it really doesn’t matter too much. As an example, AWS’s cheapest storage, S3 Glacier Deep Archive, works out to about $0.001 a month per GB.
But if you’re using Amazon’s Elastic Block Storage like the kind of storage needed for running your own SQL Servers in the cloud, the cost can be closer to $.08 a month per GB.
The scale on the triangle graph above really matters.
Strategies
This stresses the need for a data life-cycle policy. An exit story for large volumes of data. Try to implement Time-To-Live (TTL) or clean up mechanisms right from the beginning of even the smallest project. Here’s one quick easy example from a project I wrote that collects wait stats. The clean-up is a single line.
Look at Netflix does approaches this issue. I like how they put it. “Data storage has a lot of usage and cost momentum (i.e. save-and-forget build-up).”
Netflix stresses the importance of “cost visibility” and they use that to offer focused recommendations for cleaning up unused data. I recommend reading that whole article. It’s fascinating.
It’s important to implement such policies before that triangle graph gets too large.

[…] Michael J. Swart talks about costs: […]
Pingback by Cumulative Costs and Scale – Curated SQL — October 7, 2022 @ 8:05 am