A couple weeks ago, I wrote about how to find lonely tables in Sql Server. This is a follow up to that post. I’m now going to talk about small sets of tables that are joined to eachother, but no-one else.
It’s Not Just Me
It seems everyone’s talking about this.
So as I was writing this post and code I noticed an amazing coincidence. I saw the same ideas I was writing about being discussed on twitter by Kelly Sommers, Ben Johnson and others.
They discuss Uber’s microservice graph. When visualized, it’s a big mish-mash of dependencies. Kelly points out how hard it is to reason about and Ben points to a small decoupled piece of the system that he wants to work on.
I wanna work on this part of the system. pic.twitter.com/K0zLIJAXVv
— Ben Johnson (@benbjohnson) March 26, 2019
Me too Ben! And I think that’s the value of that visualization. It can demonstrate to others how tangled your system is. It can also identify small components that are not connected to the main mess. When I tie it to my last post and consider this idea in the database world, I can expand my idea of lonely tables to small sets of tables that are never joined to other tables.
I want to find them because these tables are also good candidates for extraction but how do I find them? I start by visualizing tables and their joins.
Visualizing Table Joins
I started by looking for existing visualizations. I didn’t find exactly what I wanted so I coded my own visualization (with the help of the d3 library). It’s always fun to code your own physics engine.
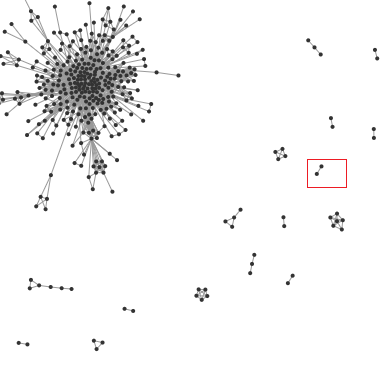
Here’s what I found

A monolith with some smaller isolated satellites

An example that might be good to extract
That ball of mush in the middle is hard to look at, but the smaller disconnected bits aren’t! Just like Ben, I want to work on those smaller pieces too! And just like the lonely tables we looked at last week, these small isolated components are also good candidates for extracting from SQL Server.
Try It Yourself
I’ve made this visualization available here:
https://michaeljswart.com/show_graph/show_graph.html
There’s a query at the end of this post. When you run it, you’ll get pairs of table names and when you paste it into the Show Graph page, you’ll see a visualization of your database.
(This is all client-side code, I don’t collect any data).
The Query
use [your database name goes here]; select qs.query_hash, qs.plan_handle, cast(null as xml) as query_plan into #myplans from sys.dm_exec_query_stats qs cross apply sys.dm_exec_plan_attributes(qs.plan_handle) pa where pa.attribute = 'dbid' and pa.value = db_id(); with duplicate_queries as ( select ROW_NUMBER() over (partition by query_hash order by (select 1)) r from #myplans ) delete duplicate_queries where r > 1; update #myplans set query_plan = qp.query_plan from #myplans mp cross apply sys.dm_exec_query_plan(mp.plan_handle) qp ;WITH XMLNAMESPACES (DEFAULT 'http://schemas.microsoft.com/sqlserver/2004/07/showplan'), mycte as ( select q.query_hash, obj.value('(@Schema)[1]', 'sysname') AS schema_name, obj.value('(@Table)[1]', 'sysname') AS table_name from #myplans q cross apply q.query_plan.nodes('/ShowPlanXML/BatchSequence/Batch/Statements/StmtSimple') as nodes(stmt) CROSS APPLY stmt.nodes('.//IndexScan/Object') AS index_object(obj) ) select query_hash, schema_name, table_name into #myExecutions from mycte where schema_name is not null and object_id(schema_name + '.' + table_name) in (select object_id from sys.tables) group by query_hash, schema_name, table_name; select DISTINCT A.table_name as first_table, B.table_name as second_table from #myExecutions A join #myExecutions B on A.query_hash = B.query_hash where A.table_name < B.table_name; |


Another option if you care about foreign keys instead of joins is to use this query:
Comment by Michael J. Swart — April 3, 2019 @ 10:16 am
[…] Michael J. Swart performs cluster analysis with tables: […]
Pingback by Finding Dependency Clusters – Curated SQL — April 4, 2019 @ 8:00 am
This is like a good diagnostic tool. I wonder how often these clusters are lookup tables that could be replaced with CHECK() constraints because the values don’t change often. Or perhaps with function calls some kind. At any rate, it’ll be a good tool for considering this situation.
Comment by Joe Celko — April 8, 2019 @ 2:22 pm
It is… I’ve used it to explore a schema I’m very familiar with.
There were some surprises for me and you’re right. I think it can be used as a tool to help one look at a schema perhaps from a new point of view.
Comment by Michael J. Swart — April 8, 2019 @ 4:08 pm
[…] Recursively find foreign key constraints to other tables and look at those tables. These are often explanatory data, providing context to the fact-style data above. If you need help with recursively finding key constraints, I have a script (with bonus ASCII art) and a longer post as well. If your database has no foreign keys, there are still ways around it like looking at joins in the plan cache. […]
Pingback by Forensic Accounting: Basic Analysis – 36 Chambers – The Legendary Journeys: Execution to the max! — April 16, 2019 @ 9:45 am
Wow, this is amazing. Thanks for sharing!
Comment by Darren — September 19, 2019 @ 10:33 am
I joined a company that has very weird setup, almost no relations, houndres of databases, data tossed around from one to another.
Anyway long story short I decided to visualize one of them and now I’m looking at floating pentagram…
Have a nice day!
Comment by Konrad — March 2, 2021 @ 9:58 am