Michael J. Swart

September 19, 2013

My Queries For Top 20 Resource Hogs

Filed under: SQL Scripts,SQLServerPedia Syndication,Technical Articles — Michael J. Swart @ 12:00 pm

Takeaway: This post is for me. This post is a handy place for me to put some queries that I use often. If you find them useful too, that’s wonderful, bookmark this page with https://michaeljswart.com/go/Top20.

These queries will give the top 20 resource consumers for cached queries based on a few different metrics. I’ve posted queries like this before, and others have written many other versions of this query. All these queries are based on sys.dm_exec_query_stats.

But I’ve tweaked my own queries recently based on a couple things I’ve learned. So you could say that I gave my old queries a new coat of paint.

Here what I’ve added to these queries recently:

  • I added OPTION (RECOMPILE) to the query. It prevents these queries from showing up in their own results on quiet systems.
  • Joe Sack pointed out that query_hash can be used to aggregate queries that only differ by literal values. I’m doing that here. What’s extra awesome about this technique, is that it can also be used to aggregate the same queries that were executed in different procedures or in different databases. This is critical if we want to measure the impact of a single query on a server regardless of where the query is called.
  • I’m ignoring (for now) those queries with query_hash equal to 0x0. Again, Joe Sack points out that these are cursor fetches.
  • You may notice that the database name is sometimes null. It’s null when the query is not part of a stored procedure. I suppose if I was keen, I could pick out a arbitrary database name from the accompanying query plan.
  • Update September 27, 2013: Actually, In the comment section of this post, Ian Stirk gave me a really nice way to retrieve the database name from the dmvs. I’ve updated the queries below accordingly.
  • Remember that the stats found in sys.dm_exec_query_stats are only as good as what’s in cache. The cache is not a permanent store. It changes and it gets reset every server restart.

(Download all queries)

Or check them out individually below:

Top 20 Executed Queries

These are queries that run often. Frequent queries can be vulnerable to concurrency problems.

;with frequent_queries as
(
    select top 20 
        query_hash, 
        sum(execution_count) executions
    from sys.dm_exec_query_stats 
    where query_hash <> 0x0
    group by query_hash
    order by sum(execution_count) desc
)
select @@servername as server_name,
    coalesce(db_name(st.dbid), db_name(cast(pa.value AS INT)), 'Resource') AS [DatabaseName],
    coalesce(object_name(st.objectid, st.dbid), '<none>') as [object_name],
    qs.query_hash,
    qs.execution_count,
    executions as total_executions_for_query,
    SUBSTRING(st.[text],(qs.statement_start_offset + 2) / 2,
        (CASE 
            WHEN qs.statement_end_offset = -1  THEN LEN(CONVERT(NVARCHAR(MAX), st.text)) * 2
            ELSE qs.statement_end_offset + 2
            END - qs.statement_start_offset) / 2) as sql_text,
    qp.query_plan
from sys.dm_exec_query_stats qs
join frequent_queries fq
    on fq.query_hash = qs.query_hash
cross apply sys.dm_exec_sql_text(qs.sql_handle) st
cross apply sys.dm_exec_query_plan (qs.plan_handle) qp
outer apply sys.dm_exec_plan_attributes(qs.plan_handle) pa
where pa.attribute = 'dbid'
order by fq.executions desc,
    fq.query_hash,
    qs.execution_count desc
option (recompile)

Top 20 I/O Consumers

Specifically logical reads and writes. Still my favorite metric.

;with high_io_queries as
(
    select top 20 
        query_hash, 
        sum(total_logical_reads + total_logical_writes) io
    from sys.dm_exec_query_stats 
    where query_hash <> 0x0
    group by query_hash
    order by sum(total_logical_reads + total_logical_writes) desc
)
select @@servername as servername,
    coalesce(db_name(st.dbid), db_name(cast(pa.value AS INT)), 'Resource') AS [DatabaseName],
    coalesce(object_name(st.objectid, st.dbid), '<none>') as [object_name],
    qs.query_hash,
    qs.total_logical_reads + total_logical_writes as total_io,
    qs.execution_count,
    cast((total_logical_reads + total_logical_writes) / (execution_count + 0.0) as money) as average_io,
    io as total_io_for_query,
    SUBSTRING(st.[text],(qs.statement_start_offset + 2) / 2,
        (CASE 
            WHEN qs.statement_end_offset = -1  THEN LEN(CONVERT(NVARCHAR(MAX),st.[text])) * 2
            ELSE qs.statement_end_offset + 2
            END - qs.statement_start_offset) / 2) as sql_text,
    qp.query_plan
from sys.dm_exec_query_stats qs
join high_io_queries fq
    on fq.query_hash = qs.query_hash
cross apply sys.dm_exec_sql_text(qs.sql_handle) st
cross apply sys.dm_exec_query_plan (qs.plan_handle) qp
outer apply sys.dm_exec_plan_attributes(qs.plan_handle) pa
where pa.attribute = 'dbid'
order by fq.io desc,
    fq.query_hash,
    qs.total_logical_reads + total_logical_writes desc
option (recompile)

Top 20 CPU Consumers

Another popular metric for measuring work done.

;with high_cpu_queries as
(
    select top 20 
        query_hash, 
        sum(total_worker_time) cpuTime
    from sys.dm_exec_query_stats 
    where query_hash <> 0x0
    group by query_hash
    order by sum(total_worker_time) desc
)
select @@servername as server_name,
    coalesce(db_name(st.dbid), db_name(cast(pa.value AS INT)), 'Resource') AS [DatabaseName],
    coalesce(object_name(st.objectid, st.dbid), '<none>') as [object_name],
    qs.query_hash,
    qs.total_worker_time as cpu_time,
    qs.execution_count,
    cast(total_worker_time / (execution_count + 0.0) as money) as average_CPU_in_microseconds,
    cpuTime as total_cpu_for_query,
    SUBSTRING(st.[text],(qs.statement_start_offset + 2) / 2,
        (CASE 
            WHEN qs.statement_end_offset = -1  THEN LEN(CONVERT(NVARCHAR(MAX),st.[text])) * 2
            ELSE qs.statement_end_offset + 2
            END - qs.statement_start_offset) / 2) as sql_text,
    qp.query_plan
from sys.dm_exec_query_stats qs
join high_cpu_queries hcq
    on hcq.query_hash = qs.query_hash
cross apply sys.dm_exec_sql_text(qs.sql_handle) st
cross apply sys.dm_exec_query_plan (qs.plan_handle) qp
outer apply sys.dm_exec_plan_attributes(qs.plan_handle) pa
where pa.attribute = 'dbid'
order by hcq.cpuTime desc,
    hcq.query_hash,
    qs.total_worker_time desc
option (recompile)

Top 20 Queries By Elapsed Time

Results found here, but not in the results of the other queries, usually suffer from things like excessive blocking or ASYNC_NETWORK_IO.

;with long_queries as
(
    select top 20 
        query_hash, 
        sum(total_elapsed_time) elapsed_time
    from sys.dm_exec_query_stats 
    where query_hash <> 0x0
    group by query_hash
    order by sum(total_elapsed_time) desc
)
select @@servername as server_name,
    coalesce(db_name(st.dbid), db_name(cast(pa.value AS INT)), 'Resource') AS [DatabaseName],
    coalesce(object_name(st.objectid, st.dbid), '<none>') as [object_name],
    qs.query_hash,
    qs.total_elapsed_time,
    qs.execution_count,
    cast(total_elapsed_time / (execution_count + 0.0) as money) as average_duration_in_microseconds,
    elapsed_time as total_elapsed_time_for_query,
    SUBSTRING(st.[text],(qs.statement_start_offset + 2) / 2,
        (CASE 
            WHEN qs.statement_end_offset = -1  THEN LEN(CONVERT(NVARCHAR(MAX),st.[text])) * 2
            ELSE qs.statement_end_offset + 2
            END - qs.statement_start_offset) / 2) as sql_text,
    qp.query_plan
from sys.dm_exec_query_stats qs
join long_queries lq
    on lq.query_hash = qs.query_hash
cross apply sys.dm_exec_sql_text(qs.sql_handle) st
cross apply sys.dm_exec_query_plan (qs.plan_handle) qp
outer apply sys.dm_exec_plan_attributes(qs.plan_handle) pa
where pa.attribute = 'dbid'
order by lq.elapsed_time desc,
    lq.query_hash,
    qs.total_elapsed_time desc
option (recompile)

By the way. This post seems to be really popular. So I waive any copyright I have on these four queries. Copy them without attribution wherever you like. Profit if you can. Go nuts.

September 13, 2013

Without ORDER BY, You Can’t Depend On the Order of Results

Filed under: Miscelleaneous SQL,SQLServerPedia Syndication,Tongue In Cheek — Michael J. Swart @ 10:25 am

The title says it all. In a SQL Query, you can’t depend on the order that rows are returned without using the ORDER BY clause.

Years ago, this was one of the first lessons I learned about SQL. Without using ORDER BY I was assuming a particular order for returned rows and things went fine for a while. Then it simply “broke”: the results came back in an unexpected order. We quickly fixed the problem, but the client wanted to know what happened. They asked “What changed?” and the best answer that I could come up with is that our luck ran out. We were never entitled to assume an order to that particular set of results.

That’s all I wanted to say. Hmm… That makes for a short blog post eh?

It bears repeating and so why not. I’m going to re-explain myself. But this time I’ll do it as other bloggers you may or may not follow.

SQL Blog Impressions:

As Brent Ozar

The other day when I got back from walking my dog, I opened my Surface (my Surface Pro, not my Surface RT) and surfed the forums. Someone was wondering about the order of query results that didn’t use an ORDER BY clause. BWAAAAH! You can’t do that. After I cleaned the coffee off my monitor, I replied tactfully that you can’t depend on the order here. If you need to order your results, you need to use the ORDER BY clause. Better yet, sort the records in the app. App server CPU is way cheaper than SQL Server CPU. Sign up here for next Tuesday’s webcast about this very topic.

[Ed: It was inevitable, Brent tackles that question here]

As Pinal Dave

Kind sir or madam, allow me to welcome you to my humble website where I blog about my SQL Server journey and share with you what I’ve learned. You searched the web for SQL Server answers and clicked on the first link. That’s what brought you here and it’s my sincerest wish that I can help you out with your problem today.
Today I’m exploring the ordering of results when the ORDER BY clause is not used. Let us see what happens:

<One succinct explanation and example later…>

In conclusion, it is a mistake to believe that there is an order to results when the ORDER BY clause is not used.

[Ed: Pinal Dave is so prolific, I shouldn’t have been surprised to find out that he has in fact blogged before on this very topic!]

As Aaron Bertrand

The ANSI-SQL standard specifies ORDER BY as the only way to sort rows in a query. Without the ORDER BY clause, the rows may be returned in any way that SQL Server sees fit. It’s such an important fact, that I believe Microsoft should dedicate at least 50 per cent of the SQL Server Management Studio splash screen for the purpose of warning you. I’ve created a connect item for it so please go and vote.

Excuse me… I have to go, Microsoft just released a new cumulative update for SQL Server.

As Paul White

Examine a query without an ORDER BY clause; the order of the resulting rows is non-deterministic even though it may seem otherwise. We can tell because the input tree for a query with an ORDER BY clause contains the logical operators LogOp_OrderByCOL or LogOp_OrderByQCOL. The optimizer will then take steps to ensure the correct sort order. It will take advantage of existing indexes. Alternatively, the optimizer can choose to use a sort operator if needed.
Without the ORDER BY statement, the optimizer won’t enforce the order and so the order of returned rows can not be determined. It’s unwise to look at the execution plan and make a guess, your query plan could change at any time. And on top of that, the query optimizer algorithms can change at any version, SP or CU.

As Karen Lopez

Yesterday afternoon I was tweeting about data, Barbies and astronauts, and data about Barbie astronauts. It occurred to me that I really should be focusing on the conference session I was at. Especially since I was only half way through presenting it.
I was at my favourite conference centre and an attendee had just asked whether queries without ORDER BY clauses came back ordered by the Primary Key or the Clustered Key? It was an odd question to get during a talk about data modelling. I explained that the answer is neither: Without an ORDER BY clause, no order is guaranteed. Love your data people! And the order it comes in!
Hey, if you’re in Toronto next month

could you feed my cats?

As Paul Randal

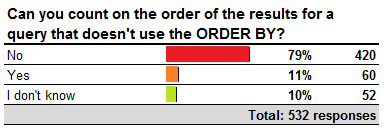
Last week I asked you whether you could depend on the results of a query without an ORDER BY clause.

PollResults

I’m encouraged that the “No” answer was most prevalent because that is the correct answer. It’s not data corruption, it’s the way that SQL Server works and it has since at least SQL Server 2005 when I worked on the team. So remember the ORDER BY clause if you need to depend on the order (and don’t forget to run DBCC CHECKDB afterwards).

September 11, 2013

Three More Tricky Tempdb Lessons

Filed under: SQLServerPedia Syndication,Technical Articles — Tags: — Michael J. Swart @ 12:00 pm

Takeaway: Tempdb contention is a common DBA problem. I want to share three lesser known surprises about everyone’s favorite bottleneck.

If my professional life was made into a series, tempdb contention would have a recurring role as the antagonist. It provides challenges on a regular basis and I finally believe I understand it’s behavior well enough to have contention licked for good. But even recently, tempdb still holds some surprises for me.

You Can Still Get SGAM Contention After TF1118

You may know what trace flag TF1118 does. It affects the allocation of pages in all databases. But it’s most often used for its effect in tempdb. The idea is that TF1118 will cause SQL Server to store all table data in dedicated extents rather than mixed extents. Without mixed extents, the need to access SGAM pages is reduced and that leads to less contention as described in this KB article.

But the use of SGAM isn’t reduced to zero. What?! How can that be? Who’s still using mixed extents? It turns out that IAM pages are always stored on mixed extents. Every time any object is created (or destroyed) that will require at least one latch on an SGAM page. On an extremely busy system, you can still see contention here.

Equally Sized Data Files Can Become Unbalanced After Autogrow

That’s not the surprising thing. The surprising thing is that it can impact the effectiveness of having multiple data files and it needs to be kept in mind. Once again from Microsoft:

If data files [have] unequal sizes, the proportional fill algorithm tries to use the largest file more for GAM allocations instead of spreading the allocations between all the files.

This makes multiple data files less effective than it could be when tackling contention. But don’t disable auto-grow, just size your tempdb data files large enough (Tip: google “instant file initialization”)

Before we move on, if your tempdb data files have auto-grown, do you know what the initial sizes were?

Tempdb Contention Can Be Sudden and Catastrophic

I hadn’t seen this before. Most contention I’m familiar with looks like a “sluggish” database. The response times on particular queries just aren’t what they ought to be – getting gradually worse until the impact is felt hard. But just recently I have seen tempdb contention show up all-of-a-sudden making the database nearly useless. Especially after excessive blocking kicks in. Here’s how that can happen:

  • Imagine a super-frequent procedure creates a temp table.
  • Several of these temp tables are cached. (There can be several execution contexts for the procedure and so several temp tables).
  • A table used in the procedure has enough modified rows to have it’s statistics auto-updated.
  • The procedure’s query plan is invalidated and is dropped from the cache.
  • The cached temp tables that were used for the procedure are marked to be destroyed
  • The procedure is recompiled and new temp tables are created
  • A system process destroys the marked temp tables that need to be cleaned up

With a very busy system, these things can happen in only a few seconds. In fact those two last items describe actions where hundreds of threads can get into a fight over allocation pages.

The following query may give a list of query plans for frequently called procedures as described:

with frequentSprocs as 
(
    select top 10 count(1) as [memory objects], cp.plan_handle from sys.dm_exec_cached_plans cp
    cross apply sys.dm_exec_cached_plan_dependent_objects(cp.plan_handle) do
    join sys.dm_os_memory_objects mo
        on do.memory_object_address = mo.memory_object_address
    where objtype = 'Proc'
    group by cp.plan_handle
    order by 1 desc
)
select fs.*, qp.query_plan
from frequentSprocs fs
cross apply sys.dm_exec_query_plan(fs.plan_handle) qp
option (recompile)

What Next?

I’m lucky to work with software that runs on systems that are crazy powerful and crazy busy. It’s unlikely that you’ll run into tempdb problems in the exact same way that we did. So the typical advice for PFS/GAM/SGAM contention is still valid:

  • Enable trace flag TF 1118
  • Create multiple (equally sized) data files for tempdb
  • Reduce how frequently you use temp tables and table variables


Powered by WordPress