What am I looking at here?
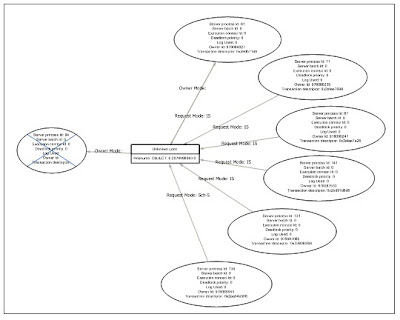
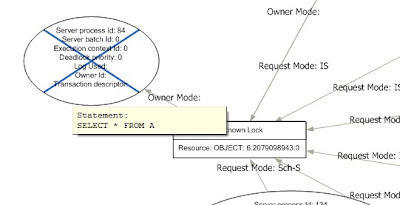
Shown above is a set of blocked process report. But it’s being displayed using SQL Server’s Deadlock Graph Control. Here’s a detail of the graph:
I’m totally wearing my hacker hat with this. Microsoft built the deadlock graph control to display deadlock graphs generated by Microsoft’s tools. What I’ve done is to take a set of blocked process reports and reformat them to look like a deadlock graph. You can tell that it’s not a deadlock because the graph is a tree, with no cycles.
See that process with the X through it. Normally it indicates a deadlock victim. But in this case, I’ve repurposed the X to indicate the lead blocker (i.e. the stalled car in the traffic jam of blocked SQL Servers).
Why?
The graph is useful because it can tell a story graphically that would otherwise take maybe 100 times longer to understand by reading the xml reports directly.
A few years ago when I installed SQL Server 2005 for the first time, I played around with SQL Server profiler and traces in general and had one of those moments that made me say “nifty!” I was looking at a deadlock graph displayed graphically.
Not much later after that, I noticed that blocked process reports contain information very similar to deadlock graphs. It wasn’t much of a leap to think that with a little creative reformatting, I could make the deadlock graph control do something else useful with blocked process reports.
How?
So here’s what you do:
- Find a trace that contains blocked processes reports. If it’s not already, save it as a table called blocked. The script below assumes that a table called blocked has already been created. (Alternatively, create an synonym called blocked that refers to a table)
- Copy the script below and run it in Management Studio.
- Click the blocking chain xml of interest to you.
- Save the xml file as an xdl file.
- Close and reopen the file in Management Studio.
The man behind the curtains.
So here’s the script I talked about. It’s also an example of me flexing my XML muscles.
Update Mar. 29, 2010 Due to the size of the script and some other formatting issues, I’m providing the script as a link rather than something to copy and paste. Download the script here.


This much processing is best done in an application layer. In fact, I thought about making this a project on codeplex.com. I also wanted to provide something where I could “show my work”. If you’re actually interested in doing something like this in a windows forms application, you should look at Microsoft.SqlServer.Management.SqlMgmt.Deadlock found at ~\Tools\Binn\VSShell\Common7\IDE\sqlmgmt.dll. And don’t forget to reference ~\Tools\Binn\VSShell\Common7\IDE\Microsoft.AnalysisServices.Graphing.DLL
Comment by Michael J. Swart — September 10, 2009 @ 6:11 am
You may notice that I use "unknown lock" for the resources in the graph. I could have also used more appropriate locks (like key locks, rid locks, table locks etc…) but I thought unknown lock suited my purposes just fine.
Comment by Michael J. Swart — September 10, 2009 @ 6:12 am
Update: The original blog post had a script where xml literals were interpreted as html. I've updated the script.
Comment by Michael J. Swart — September 10, 2009 @ 7:04 am
Nice, however, the script produces an error…
"XQuery: SQL type 'xml' is not supported in XQuery"
in line…
"SET @chainXML.modify('insert sql:variable("@blockedprocess") into (//process-list)[1] ')
Comment by Anonymous — September 17, 2009 @ 5:51 pm
Huh. As it turns out, you can't insert an xml value into the middle of another xml value until SQL Server 2008.
http://tinyurl.com/lst3cz
For those using SQL 2005, then I've left the workaround as an exercise for the reader.
Comment by Michael J. Swart — September 18, 2009 @ 4:43 am