Michael J. Swart

September 28, 2009

Detecting Loops using Recursive CTEs

Filed under: SQL Scripts,Technical Articles — Tags: , , , , — Michael J. Swart @ 5:29 am

I want to write (for posterity) a solution to a problem I encountered last week. I was asked a question about the following error message:

The statement terminated. The maximum recursion 100 has
been exhausted before statement completion.

I was dealing with a table that represented a (0..*) to (0..*) relationship between objects I’ll call THINGS1:

CREATE TABLE PARENTS
(
   ParentId INT NOT NULL REFERENCES THING(Id),
   ChildId INT NOT NULL REFERENCES THING(Id),
   PRIMARY KEY (ParentId, ChildId)
)

We were attempting to populate a similar table called ANCESTORS using a recursive CTE. I suspected that the recursive CTE was not terminating because of a loop in the PARENTS table. That is to say, the data in the PARENTS table implied that some THING was its own ancestor. (Think of it this way, if you are your own parent, that also means you’re your own grandparent, great-grandparent etc…)

To help fix the data I needed to write a query that returned a list of all THINGs that were (somehow) their own ancestor. This is what I came up with. It’s inefficient, but it did the trick.

;WITH ANCESTORS_CTE
AS (
     SELECT ParentId AS AncestorId, ChildId AS DescendantId, 1  AS Depth
     FROM PARENTS
     UNION ALL
     SELECT ANCESTORS_CTE.AncestorId, PARENTS.ChildId, ANCESTORS_CTE.Depth + 1 AS Depth
     FROM ANCESTORS_CTE
     JOIN PARENTS
          ON ANCESTORS_CTE.DescendantId = PARENTS.ParentId
     WHERE ANCESTORS_CTE.Depth < 10
)
SELECT DISTINCT AncestorId
FROM ANCESTORS_CTE
WHERE AncestorId = DescendantId

1 Mathematically speaking, the PARENTS table represents the adjacency matrix of a directed acyclic graph.

September 25, 2009

CHAR: What is it Good For?

Filed under: Technical Articles — Tags: , , , , , , — Michael J. Swart @ 7:06 am

Takeaway: … Absolutely nothing (say it again).

What’s the difference between the CHAR datatype and the VARCHAR datatype? At the time of this writing Google gives thousands of web pages that are willing to explain the difference. Or if not explaining the difference at least explaining which is better and when. Here are two of the more interesting or important links:

What this Blogger Thinks
I’m going to put my vote with VARCHAR over CHAR in almost all circumstances. I’m going to list what I think are the stated benefits of CHAR and then hopefully show that the benefits are outweighed by consistency you get from applying VARCHAR as a rule of thumb always. (n.b. Throughout this post, the same arguments apply to NCHAR vs. NVARCHAR.)

Data Integrity:
Does SQL Server Complain if you give CHAR (10) less than ten characters?
At first glance, you might assume (the way I did) that the following benefit: That

CREATE TABLE example1 ( col CHAR (10) )

is somehow equivalent to

CREATE TABLE example2
(
    col VARCHAR (10),
    CHECK (LEN (col) = 10)
)

But it turns out not to be the case. Inserting strings shorter than ten characters into the column in example 1 does not produce an error. Instead, SQL Server pads the value with enough spaces to fill out the value of the column.

Size
And so we get to it. The main consideration when deciding between these types always seems to be size. VARCHAR as you know takes only the characters it needs, but it uses an extra two bytes to store the length of the string. That’s why Microsoft recommends using CHAR for strings that are going to be a consistent length.

So, I’ve decided to find out how much exactly. Using the sample database Adventureworks, I changed the tables that used NCHAR columns to identical tables that use NVARCHAR columns. And I found that the number of pages consumed was exactly the same (even after rebuilding indexes). I expected that though. The small savings you get in that case was not enough to be able to fit extra rows into a database page.

But here’s something that surprised me regarding null-able columns. If you are counting every byte, you’ll see that VARCHAR is the clear space saver when it comes to NULLS. You’ll find that CHAR (10) columns that are NULL still take ten bytes while VARCHAR (10) columns take zero bytes. This is another reason to pick VARCHAR over CHAR.

Semantics
What about semantically? When application developers sees a CHAR (10) column, it’s clear to them that data in the column is expected to be exactly 10 characters. This is a benefit to the CHAR data type.
It is not something that the VARCHAR data type conveys nicely. Even with a CHECK constraint or with documentation.

So I’ll concede that. Even though it’s possible to create user defined types that do something similar:

CREATE TYPE PostalCode FROM VARCHAR (6);
CREATE TYPE SIN FROM VARCHAR (9);
CREATE TYPE OneChar VARCHAR (1);

So are CHARS Completely Useless?
No, but I don’t see any real significant advantage either. And so I think it’s easier to apply VARCHAR as a rule of thumb and as a best practice without worrying about whether it’s better than CHAR. So pick VARCHAR and be done with it.

September 16, 2009

What the devil?

Filed under: Miscelleaneous SQL — Tags: , , — Michael J. Swart @ 8:59 pm

The devil you know vs. the devil you don’t.
A good friend of my told me about an issue she recently came across. It seems that a particular group of admins implemented SQL Server database mirroring in order to implement a kind of relatively cheap high availability solution. It’s a useful strategy that’s discussed in a number of places. Here and here for example. 

Well, something went wrong or I wouldn’t be writing right now. I’m not familiar with all of the details, but there was some wrinkles with the performance of the network and the database server became extremely slow. (despite what you might think, this really isn’t an article about database mirroring) It’s ironic that the very thing that was implemented to increase up-time was the cause of down-time.

From another perspective, this is a case of “The devil you know vs. The devil you don’t.” Here, they traded the devil they knew – that is, not having a warm standby server – with a devil they didn’t – in this case, production uptime now depended on network performance in an unexpected way.

Other examples of known vs. unknown devils:

  • Known bugs in version 1.0 vs. Unknown introduced bugs in version 2.0
  • Raid 0 vs. Misconfigured SANs
  • Reliability of municipal power vs. Possibly fawlty UPS systems
  • Add your own examples to the comments! (best two comments get a No-Prize – extra points for irony.)

I’ve actually witnessed the unknown devils above. And as a lover of irony, I smiled (tempered slightly by sympathy for those whose necks were on the line).

The devil is in the details
In the examples I’ve mentioned above, the unknown devils reared their heads because of exposure to an unforeseen risk. What can you do about it though? Well, what else is there to do? Get to know that unknown devil. Test, test, test with all the time and resources available to you. There really is no short-cut. And sometimes, with the right testing, if you’re thorough enough you can get it right…

God is in the details*
Getting it right means you get the high availability you were hoping for. The uninterupted power. Secure systems, the robust bug free software. Maybe even five nines.

I’ll leave you with one last devil you know vs. devil you don’t example. It’s a picture of me and my brother. Presumably you know me and not him. But which is the evil one? Increased difficulty: neither of us have a goatee. Unfair: the photos have been scrambled.

Who’s the evil one?

* — BTW, “God is in the details” is a quote by architect Mies van der Rohe. I’m in good company when quoting architects for this industry; you’ve heard of design patterns right?

September 10, 2009

View Blocked Process Reports using the Deadlock Graph Control

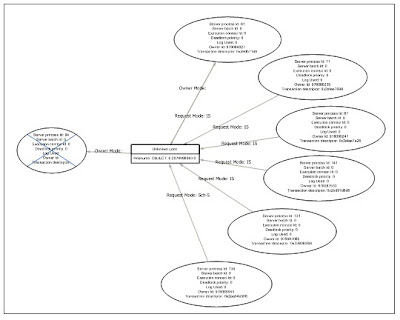
What am I looking at here?
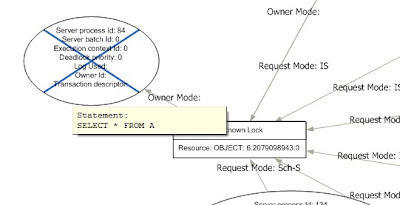
Shown above is a set of blocked process report. But it’s being displayed using SQL Server’s Deadlock Graph Control. Here’s a detail of the graph:
I’m totally wearing my hacker hat with this. Microsoft built the deadlock graph control to display deadlock graphs generated by Microsoft’s tools. What I’ve done is to take a set of blocked process reports and reformat them to look like a deadlock graph. You can tell that it’s not a deadlock because the graph is a tree, with no cycles.
See that process with the X through it. Normally it indicates a deadlock victim. But in this case, I’ve repurposed the X to indicate the lead blocker (i.e. the stalled car in the traffic jam of blocked SQL Servers).
Why?
The graph is useful because it can tell a story graphically that would otherwise take maybe 100 times longer to understand by reading the xml reports directly.
A few years ago when I installed SQL Server 2005 for the first time, I played around with SQL Server profiler and traces in general and had one of those moments that made me say “nifty!” I was looking at a deadlock graph displayed graphically.
Not much later after that, I noticed that blocked process reports contain information very similar to deadlock graphs. It wasn’t much of a leap to think that with a little creative reformatting, I could make the deadlock graph control do something else useful with blocked process reports.
How?
So here’s what you do:
  1. Find a trace that contains blocked processes reports. If it’s not already, save it as a table called blocked. The script below assumes that a table called blocked has already been created. (Alternatively, create an synonym called blocked that refers to a table)
  2. Copy the script below and run it in Management Studio.
  3. Click the blocking chain xml of interest to you.
  4. Save the xml file as an xdl file.
  5. Close and reopen the file in Management Studio.
The man behind the curtains.
So here’s the script I talked about. It’s also an example of me flexing my XML muscles.

Update Mar. 29, 2010 Due to the size of the script and some other formatting issues, I’m providing the script as a link rather than something to copy and paste. Download the script here.

September 8, 2009

Finding the Lead Blocker in a Set of Blocked Process Reports

Traffic jam by lynac on FlickrTakeaway: Skip to the end for a script that reports the lead blocker for a set of Blocked Process Reports. And tune in later this week for a nifty graphing trick for blocked process chains.

On Blocking
Sometimes SQL Server is like a highway, and is prone to traffic jams. Blocking processes (not to be confused with deadlocked processes) are processes that are waiting for resources that are being used by other processes.

Every now and then people talk about blocking chains. These are blocked processes that are waiting in a line. Process A is waiting for Process B. Process B is waiting for Process C. etc… In all cases, you want to find the lead blocker (the head of the chain) and address any issues that that process has. Think of the traffic jam analogy, it’s no good trying to focus on the Toyota that’s waiting patiently; you have to focus on the stalled Honda in the front.

I can think of two good ways to analyze blocking and blocking chains. The first method analyzes the current state of the database. The other focuses on collected trace data:

Method 1: Look at the current state of the database:
Look at the DMVs that are available, or at least to the sys.processes table. These tables provide data about the current state of the database. These tables have been discussed by Tim Chapman here and by Kalen Delaney here (Kalen’s script was written before 2005 but is still awesome). Or in short, try a variety of other solutions found here: http://www.lmgtfy.com/?q=sql+blocking.chain. I’m not going to add another solution with this post.

Method 2: Look at Blocked process report events in a trace:
Another method of analyzing blocking chains looks at data that is retrieved in one or more Blocked processes report. These Blocked process reports are generated and captured using a server-side trace or by using SQL Profiler. The blocked process report holds a ton of useful information. You can find a good example here (courtesy Johnathan Kehayias): http://jmkehayias.blogspot.com/2008/09/monitoring-for-blocked-processes-on-sql.html

Notice that there are two xml nodes under the blocked-process-report tag. These two refer to two processes, a blocked process and a blocking process (always two there are, no more, no less). So what happens if you have a blocking chain involving 12 processes? Then you’ll have 11 events in your trace. 11 blocked process reports with the same timestamp. This can make it tricky to find the lead blocker (the stalled Honda).

One way is to scan through the trace to find the process that’s been blocked the longest (the blocked process report with the largest duration). The blocking process is likely to be the lead blocker.

Or you can use this script:

WITH rankedEvents AS
(
   SELECT ROW_NUMBER() OVER (PARTITION BY EndTime ORDER BY Duration DESC) AS myRank ,
       CAST (TEXTData AS XML) AS TEXTdata
   FROM blocked
   WHERE EventClass = 137
)
SELECT TEXTdata
FROM rankedevents
WHERE myRank = 1

where blocked is the name of the table where SQL trace data is stored.

Later this week I plan to describe a method where I use SQL Server’s Deadlock Graph control to display blocking chains.

Powered by WordPress