Let’s say there’s a procedure that uses a table-valued parameter (TVP), and that TVP type has a large maximum width. Something like:
-- Create a message table typeCREATE TYPE MessageTableType ASTABLE( Message VARCHAR(MAX));
-- Create a message table type
CREATE TYPE MessageTableType AS TABLE
  ( Message VARCHAR(MAX) );
Then each time the procedure is executed, SQL Server will pre-allocate six extents (48 pages) of space in tempdb whether or not it’s needed.
Measuring tempdb Activity
So what’s the problem? Well, if these procedures are called frequently (like hundreds or thousands of times per second), then the extra allocations for wide TVPs can be excessive. These allocations can cause tempdb latch contention.
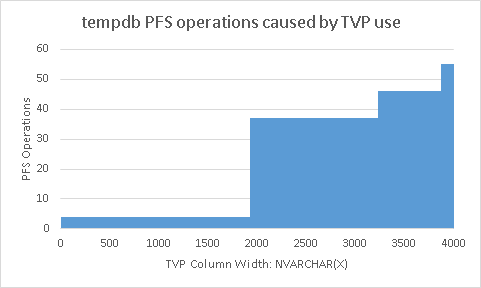
I found that SQL Server will allocate tempdb space based on the width of a TVP table. If a TVP uses a table type that has a NVARCHAR(10) column, then SQL Server doesn’t pre-allocate any space at all. But if the TVP table type has a NVARCHAR(4000) column, then SQL Server will allocate six extents of space. To measure the tempdb activity exactly, I wrote a program which let me generate this:
This chart takes some explaining. But first notice that a single query can cause up to 56 tempdb PFS operations!
Here’s how my program helped me create this chart. It starts by creating a table type. The table type has one column of type NVARCHAR(X). Next, the program executes a simple query that uses a table-valued parameter of that table type. The program measures the number of tempdb allocations and deallocations for various TVP widths: (X ranges from 1 to 4000). Also notice that
I’m focusing on PFS operations here, but GAM activity shows similar activity
The x axis corresponds to the maximum width of the column in the table type
The y axis corresponds to the number of PFS operations found in tempdb. An extent is allocated with one PFS operation, but deallocated one page at a time, this results in nine PFS operations per extent.
The steps correspond to four, five and six extents.
There is some overhead associated with creating and dropping tempdb objects. But that overhead is avoided with temp table caching. And those operations have been removed from this chart.
Table types that can be wider than a 8000 bytes such as those with multiple columns or with NVARCHAR(MAX) columns are treated the same as table types with an NVARCHAR(4000) column; they’re given six extents of space.
What I Think
I’m still making an assumption that transaction log operations on PFS and GAM pages share a one-to-one relationship with latches on those pages. But experimentally, I have seen that skinny TVPs do in fact enjoy much higher throughput than wider TVPs. In general, this is really hard to measure. I’m frustrated that there are no good metrics to help measure this kind of thing.
Six extents for wide TVPs is really excessive and causes unnecessary pressure on tempdb latches when used frequently. I now begin to worry about the width of table types and the frequency that they’re used as table-valued parameters. But I don’t think we should have to. Stuff like this should be the concern of the database engine, not the database administrator.
I discovered that digging into tempdb’s transaction log using the undocumented fn_dblog is a surprisingly useful technique for finding data to help battle tempdb contention. But it’s not easy. The transaction log is cryptic and sorting through the information can be difficult.
Like many many others, I’ve found it difficult to avoid or diagnose tempdb allocation contention issues. Typical advice includes
Use multiple equally-sized data files for tempdb
Use trace flag 1118 in order to allocated full extents instead of mixed extents
Look at your applications to reduce queries that use tempdb
It’s that last point that is so tricky. I need to find out what parts of my application are using tempdb but it’s used for so many different things. Robert Davis lists eighteen different ways that SQL Server uses tempdb in his whitepaper Demystifying tempdb Performance and Manageability. So in order to tackle tempdb allocation contention, there are two things I want to do. I want to (A) measure tempdb allocations and (B) dig into tempdb allocations.
The Trouble (a Quick Recap)
Remember, tempdb is a resource shared by everyone using the database server. When a process wants to use space in tempdb, it allocates pages. Part of that allocation involves calling dibs for those pages by updating the Page Free Space (PFS) page and the Global Allocation Map (GAM) page. But updating those pages involves taking a short-lived latch on them. So with enough activity, we can see latch contention on these pages. Other people have done a better job explaining that than I did just now. You can probably find many of those explanations by googling tempdb latch contention.
Measuring Tempdb Allocations
So if latches on tempdb pages are a limited resource, then it would be wonderful to measure how often latches are taken there. That way developers could experiment to determine what activities use tempdb and to what extent. Right now, that can’t be measured. Maybe we’re spoiled. We have a wide variety of extended events and a rich set of dynamic management views that let us dig really deep into SQL Server internals. But when it comes to measuring tempdb latches, there’s no suitable metric.
Here’s how Microsoft comes close:
Metric
Why It’s Not What I Want
Performance counter Database transactions/sec specifically the tempdb database.
This is a gauge metric and it would be useful if every tempdb transaction allocated a small number of pages. But at least one kind of activity – tempdb spills – will allocate many pages in a single tempdb transaction and that activity gets hidden.
These are useful when you want to categorize tempdb allocations. It’s reports the number of tempdb allocations that have been taken for any given point in time. But tempdb allocations taken by long-running transactions can be over-reported and short-running transactions tend to be missed. This makes it difficult to tell whether the data indicates typical tempdb allocations or whether it’s just showing long held allocations.
Performance counter Page latch waits in Wait Statistics, specifically Waits started per second.
This is an alarm metric and not specific to tempdb.
Again, these are all alarm metrics and not specific to tempdb.
Peformance counter Pages Allocated/sec or Page Deallocations/sec in Access Methods
I really like this one. It’s not tempdb specific, but it’s a gauge metric and it’s getting close to what I want.
Performance counter Tempdb latches/sec with instances on GAM, SGAM and PFS
Oooh perfect. Too bad this performance counter is fictional. It doesn’t exist. I would love this metric if it existed because it would be a gauge metric that most directly corresponds to tempdb contention problems.
Digging into Tempdb Allocations
Putting metrics aside for the moment, I’ve also tried a number of ways to dig into events and logs in order to tie tempdb use with user activity. I’ve had limited success with these two methods:
There are new extended events called sqlserver.mixed_extent_allocation and sqlserver.mixed_extent_deallocation introduced in SQL Server 2014, but these are focused on mixed extents (which I already avoid by enabling trace flag TF-1118).
But it turns out that tempdb’s transaction log is rich with information (even though a lot of it is cryptic).
Digging into Tempdb’s Transaction Log
The easiest way to look at tempdb’s transaction log is by using fn_dblog:
use tempdb;
select*from fn_dblog(null, null);
use tempdb;
select * from fn_dblog(null, null);
But it can be a heavy query. Here’s a light-weight query that gets the most recent 5 seconds of activity or 10000 rows whichever is less:
-- Collect tempdb log activityuse tempdb;
-- get the latest lsn for tempdbdeclare @xact_seqno binary(10);
declare @xact_seqno_string varchar(50);
exec sp_replincrementlsn @xact_seqno OUTPUT;
set @xact_seqno_string ='0x'+CONVERT(varchar(50), @xact_seqno, 2);
set @xact_seqno_string =stuff(@xact_seqno_string, 11, 0, ':')set @xact_seqno_string =stuff(@xact_seqno_string, 20, 0, ':');
-- wait for five seconds of activity:waitfor delay '00:00:05';
selecttop10000*from fn_dblog(@xact_seqno_string, null);
go
-- Collect tempdb log activity
use tempdb;

-- get the latest lsn for tempdb
declare @xact_seqno binary(10);
declare @xact_seqno_string varchar(50);
exec sp_replincrementlsn @xact_seqno OUTPUT;
set @xact_seqno_string = '0x' + CONVERT(varchar(50), @xact_seqno, 2);
set @xact_seqno_string = stuff(@xact_seqno_string, 11, 0, ':')
set @xact_seqno_string = stuff(@xact_seqno_string, 20, 0, ':');

-- wait for five seconds of activity:
waitfor delay '00:00:05';

select top 10000 *
from fn_dblog(@xact_seqno_string, null);
go
This actually lets me answer a lot of questions:
What activity is there against PFS or GAM pages?
Each operation (allocation or deallocation) is likely one page latch. So we have:
select count(*), Context
from fn_dblog(@xact_seqno_string, null)
where Context in ('LCX_PFS', 'LCX_GAM', 'LCX_SGAM')
group by Context
order by count(*) desc;
select count(*), [Transaction Name]
from fn_dblog(@xact_seqno_string, null)
where Operation = 'LOP_BEGIN_XACT'
group by [Transaction Name]
order by count(*) desc;
Transaction names are cryptic, but they are organized by activity and we can use some educated guesses to figure out what’s going on. For example, queries that use table valued parameters are called TVQuery and are often associated with transactions called AllocFirstPage, FCheckAndCleanupCachedTempTable and if the TVP’s table type has a primary key defined, then offline index build.
PFS or GAM activity by tempdb transaction type
Putting it all together:
with recentTempdbLogs as
(
    select top 10000 *
    from fn_dblog(@xact_seqno_string, null)
),
TransactionNames as
(
    select [Transaction Id], [Transaction Name]
    from recentTempdbLogs
    where Operation = 'LOP_BEGIN_XACT'
)
select tn.[Transaction Name], rtl.Context, COUNT(*) as Operations
from recentTempdbLogs rtl
join TransactionNames tn
    on tn.[Transaction Id] = rtl.[Transaction ID]
where Context in ('LCX_PFS', 'LCX_GAM', 'LCX_SGAM')
group by tn.[Transaction Name], Context
order by COUNT(*) desc
How Is This Actionable?
Remus Rusanu has a post titled How to read and interpret the SQL Server log. It gives an introduction to some of the internals involved with what you see in the transaction log. It’s not always obvious why understanding SQL Server internals helps in real world scenarios. I’ve found that it’s most useful for troubleshooting by focusing avenues of investigation (whether it’s TVPs, tempdb spills, version store stuff, etc…).
In my case, I used this data to narrow down the type of activity. Specifically I used
the Transaction SID column (giving me the user),
the SPID which gives me the session id and helps me tie it to data collected elsewhere
the AllocUnitName which I used to tie to a particular tempdb objects
There seem to be two main kinds of performance metrics, ones that measure trouble and ones that measure resources. I’ll call the first kind “alarm” metrics and the other kind “gauge” metrics. Alarm metrics are important, but I value gauge metrics more. Both are essential to an effective monitoring and alerting strategy.
Alarms
Alarms are great for troubleshooting, they indicate that it’s time to react to something. They have names containing words like timeouts, alerts and errors, but also words like waits or queue length. And they tend to be spikey. For example, think about a common alarm metric: SQL Server’s Blocked Process Report (BPR). The report provides (actionable) information, but only after a concurrency issue is detected. Trouble can strike quick and SQL Server can go from generating zero BPR events per second to dozens or hundreds. Alarm metrics look like this:
Alarm Metric
Gauges
Now contrast that with a gauge metric. Gauge metrics often change value gradually and allow earlier interventions because they provide a larger window of opportunity to make corrections.
If you pick a decent threshold value, then all gauges can generate alerts (just like alarms do!). As they approach trouble, gauges can look like this:
Gauge Metric
And the best kind of gauge metrics are the kind that have their own natural threshold. Think about measuring the amount of free disk space or available memory. Trouble occurs when those values hit zero and those guages look like this:
Decreasing Gauge Metric
Examples
I compare different gauges and alarms to further explain what I mean.
Alarms
Gauges
Avg. Disks Read Queue Length
Disk Reads/sec
Processor Queue Length
% Processor Time
Buffer Cache Hit Ratio
Page lookups/sec
“You are running low on disk space”
“10.3 GB free of 119 GB”
Number of shoppers waiting at checkout
Number of shoppers arriving per hour
Number of cars travelling slower than speed limit
Number of cars per hour
Number of rings of power tossed into mount doom
Ring distance to mount doom
Hat tip to Daryl McMillan. Our conversations led directly to this post.