Michael J. Swart

August 21, 2008

Tip: How to backup a database to a shared network drive

Filed under: Technical Articles — Michael J. Swart @ 3:22 am

An issue where SQL Server Management Studio doesn’t quite live up to expectations.

What I wanted to do:

I wanted a copy of a database that lived on a different server. I wanted the database to live on my own machine so I could do dev stuff with it. What I tried to do is backup the database and copy the backup to my own machine.

Unfortunately when you use the backup database wizard, the wizard only displays locations on local hard drives only. Not even mapped network drives show up:

In this dialog, there is seemingly* no way to specify a network drive! And in my case, there was no space to do backups on any of the local drives that were displayed.

What I ended up doing

I went ahead and specified all the backup settings using the wizard (saving the backup to a local drive). But before hitting OK, I pressed “Script” instead:

And that gave me the script shown below


BACKUP DATABASE [AdventureWorks]
TO  DISK = N'C:\Temp\AdventureWorks.bak'
WITH NOFORMAT, NOINIT, SKIP, NOREWIND, NOUNLOAD,  STATS = 10,
NAME = N'AdventureWorks-Full Database Backup'
GO

Once I had the script, I was able to change the location of the backup to a shared drive on my local computer. I specified the location using a UNC path (e.g. //MYSERVER/mySharedFolder/mybackup.bak). I ran it in a query window and it worked perfectly.

Related Microsoft Connect issues
Microsoft Connect issue 124707 sort of mentions it. Issue 126396 is closed as being fixed, but I don’t understand that.

* Update!
Ahh. Now I understand that. Turns out that you can specify a network path through the UI, but you can’t browse for it. In the Locate Database Files dialog specify the full UNC path in the file name text box. It works and more embarrassingly, it’s in the manual.

August 12, 2008

The 80-20 rule and SQL Server Performance

Filed under: Technical Articles — Tags: , , , — Michael J. Swart @ 4:26 am

The 80-20 rule (aka the Pareto principle) says that 80% of effects come from 20% of the causes. When you apply this to Quality Control in a manufacturing environment, you can then also say that 80% of defects come from 20% of the causes.

The Pareto Chart
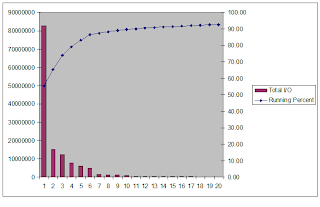
This gives rise to the pareto chart. See this google image search to get a sense of some other examples.

Essentially you plot a histogram of the top x defects in descending frequency. On a second axis, you plot the cumulative total and show that value in percentage of all causes. The picture on the right would be a perfect example if this post were called the 65-35 rule.

How does this help?
If your goal is to reduce defects, then the pareto chart can help you keep focused on the important things. My brother says this is a way of formalizing common sense. It helps make sure that the most serious defects get attention.

What does this have to do with SQL Server?
Two things really.

QC for SQL Server
The first is that you can apply the same principle of Quality Control to the performance of database servers. Instead of measuring defects, you can measure total IO or Total CPU.

SQL Server comes shipped with a few canned performance reports that give you great information. (Right-click your server in Object Explorer, Select Reports, then Standard Reports, then pick one of the Performance * reports.

I think Performance – Top Queries by Total IO and Performance – Top Queries by Total CPU are the most useful. These are histograms, and are one step away from being a Pareto chart.

I’ve made my own charts with titles like Top CPU, TOP I/O, and TOP Blocked Tables .

Reporting Services?
This second thing is that this task seems like a job for Reporting Services! Well it seems that way but it’s not.
I was given a task to create such a report once and it was hard to work with SSRS to display the report exactly as I wanted. In the end, I’m not sure the report itself was used very often.
(Update (10/17/2008): SRSS 2008 improved a lot… For an solution in 2008 see SSRS is fun again)

Recently, when faced with a task of creating another such chart, I decided to try using a third party chart. I downloaded a trial version of Dundas chart for Reporting Services. They’ve got a Pareto chart that looks like it fits the bill. But there were two things I didn’t like. The cumulative percentage line only shows the cumulative percentage of the shown data. Which makes it tricky if I want to show the TOP 20 bad queries but show percentages based on 1000 queries. Also the scale of the histogram matches the scale of the percentages which I don’t like.

Excel to the rescue!
Well in the end I found that Excel charts do what others couldn’t. Excel is the jack of all trades and master of none. By being flexible, Excel lets me get a nice pareto chart like the one shown here. Here’s how I do it.

  1. Paste the sorted data into a column in Excel. Say, for example, you’ve pasted into column B.
  2. In the next column (C), create a column with values that contain the cumulative values. So the formula in C4 would be
    =B4 + C3

    Fill this formula down for the whole column.

  3. In the next column (D), create a column with values that contain the cumulative percentages. These will be the values for the line in the pareto chart. So the formula in D4 would be
    =100*C4/SUM(B:B)

    Fill this formula down for the whole column

  4. Select the top x values in column B and D. This is the data for the pareto chart. Then select the chart wizard.
  5. In the chart wizard, the kind of chart to pick is in the Custom Types tab. Pick Line – Column on 2 Axes
  6. Press Finish and season to taste.

Why is this better?

  • I think it’s better because it’s slightly less automatic and slightly more manual. Giving users more options, especially savvy users, is wise in some cases. This is one of those cases.
  • You’ll never have to field a question like: Can I export this into Excel?
  • If you’re the consumer of the data, then you know what the data means already.
  • Updating the data is a matter of copy-paste. A little more work than a refresh button, but worth it.

August 5, 2008

Three steps to avoid blocking.

Filed under: Technical Articles — Michael J. Swart @ 3:56 pm

1. Troubleshoot acute blocking problems

Sometimes it’s too late to prevent blocking. Blocking is happening now! And it’s up to you to fix it. It’s a high-stress situation you can find yourself in and it’s often useful to find out who’s blocking who. I’ve written a query that can indicate if there’s blocking and if so who’s blocking who. Here’s a link to that query.

Best case scenario is that you can quickly identify one query (such as a maintenance task) that is blocking other people. Stop the query (unblocking others) and then spend your time analyzing and fixing the rogue query.

2. Watch for blocked processes that occur less frequently.
Consider the scenario where performance on the database suffers occasionally, but it’s sporadic and it’s hard to catch the problem red-handed. I’ve found the blocked process report really useful. It’s a new event in SQL 2005 that you can trace through profiler or any other tracing utility you use.

A couple things you need to set up first:

sp_configure 'show advanced options', 1
RECONFIGURE WITH override
GO
sp_configure 'blocked process threshold', 10
RECONFIGURE WITH override
GO

In the code above, I’ve set the blocked processes threshold to 10. So if SQL Server detects more than 10 processes that are waiting because of blocked resources, it will fire a blocked process event. This event can be traced through profiler or by using sp_trace_* sprocs. SQL Server will then wait 10 seconds before deciding to issue another blocked process report. It is designed this way to make a very lightweight trace.

By digging into the blocked process reports you’ll find that the reports can tell a very good story about blocking on your server. You can often find problems before they’re noticed by an end user. You can see we’re moving closer to proactive and further from reactive.

3. Look at blocking from the object’s point of view
So there are no acute problems and the blocked process report hasn’t popped up in a long while. You’re done right? Not necessarily. There’s one last look into your server that can help you make adjustments to database design that will really make your db scalable. So far, up until now, we’ve looked at which processes are blocking which other processes. We can now shift our point of view to look at which tables (or indexes) are participating most often in row lock waits.

The following query comes from Colin Roberts.

SELECT OBJECT_NAME(s.OBJECT_ID) AS TableName
,ISNULL(i.name,'HEAP') AS IndexName
,CASE i.index_id  
WHEN 0 THEN 'HEAP'
WHEN 1 THEN 'CLUS'
ELSE 'NC'
END AS IndexType  
,row_lock_count, row_lock_wait_count
,[block %]=CAST (100.0 * row_lock_wait_count / (1 + row_lock_count) AS numeric(15,2))
, row_lock_wait_in_ms
, [avg row lock waits in ms]=CAST (1.0 * row_lock_wait_in_ms / (1 + row_lock_wait_count) AS numeric(15,2))
FROM sys.dm_db_index_operational_stats (DB_ID(), NULL, NULL, NULL) s JOIN sys.indexes i
ON i.OBJECT_ID = s.OBJECT_ID AND i.index_id = s.index_id
WHERE OBJECTPROPERTY(s.OBJECT_ID,'IsUserTable') = 1
ORDER BY row_lock_wait_count DESC

It identifies tables that have chronic problems with regards to locking (For acute problems see step 1 or 2 or take a snapshot and compare with differences).
< br />Say you identify a table that shows a lot of blocking. You can focus your analysis on the use of that table. Identify queries that write a lot to that table and read a lot from that table. Chances are that you’ll find many such queries. With this information, you can improve db design. Here’s what some solutions might look like:

  • The columns in the table that are being updated are rarely read. Split out the updated column to its own table.
  • The table being updated is being read often in the same sproc. Maybe it’s possible to update and read in the same statement.
  • The table is very large and accessed frequently. Partition the table avoiding contention.
  • Refactor the application to access/update the table differently

Good luck

Powered by WordPress