


- Part One: Future Proofing for Concurrency
- Part Two: Look at Blocked Process Reports Collected With Extended Events
- Part Three
Takeaway: When assessing concurrency, performance testing is the primary way to ensure that a system can handle enough load concurrently. Monitoring blocked process reports does not give enough warning to anticipate blocking issues.
Logical Contention
Capacity planning is difficult for DBAs who expect growth. Will there be enough CPU, Memory or I/O to serve the anticipated load? One category falls outside those three, logical contention.
Logical contention is a problem where excessive blocking causes throughput to suffer. It would be great to get advanced warning. One essential strategy is to make use of the blocked process report. The problem is that blocked process reports are an alarm metric, not a guage metric. In other words, the blocked process report can indicate when there is a problem, but it is poor at giving advanced notice.
A Simple Concurrency Simulator
Check out this Concurrency Simulator.
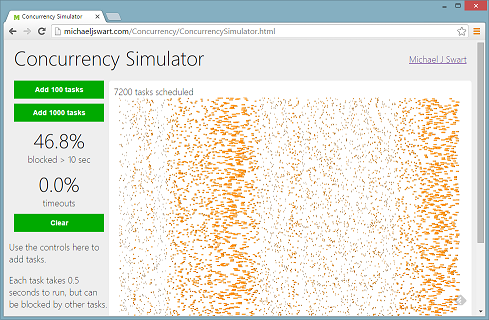
It simulates how well a server can handle tasks that use pessimistic locking (tasks that cannot be run in parallel because they block eachother). It’s amazing to see how nice things seem at 6000 tasks per hour and how quickly things can go wrong by 7000 tasks per hour. Unfortunately this scenario is too familiar. Episodes of excessive blocking tend to be either nonexistent or very painful with no in-between.
Graphically that looks like this:

You’ll notice that even at a five second threshold, the blocked process report gives us little warning. Blocked process reports don’t warn of approaching trouble, they indicate that trouble is here.
How Useful Are Blocked Process Reports Then?
Continue monitoring blocked processes. Knowing that you’ve got concurrency issues is preferable to not knowing. Just keep in mind that it can’t replace performance testing.
Other animations and interactive media by Michael J Swart

Fantastic! Any idea why waves tend to form?
Comment by mark — February 17, 2016 @ 8:33 am
Hi Mark,
My thought is that when the server’s capacity is nearly full, then by chance, randomly scheduled tasks may sometimes cause certain periods to contain a higher rate than 2 tasks per second. When that happens, blocking will cause more blocking until the average rate is back down below 2 tasks per second. So the wave is the period of time in between where the rate is above 2/sec until the time it dips back below.
What’s funny is that this is just like prod. These episodes happen with no warning and then people ask “What changed?” This best answer I can come up with is that we were nearing capacity and then got unlucky.
Comment by Michael J. Swart — February 17, 2016 @ 8:54 am
Such a nice analysis, I cannot commend you enough on this.
Another instance of services falling off a cliff is when the working set starts to exceed the buffer pool’s cache capacity. A few percent bigger working set size can cause perf to tank 10-100x (depends on the exact scenario, you can contrive arbitrarily high and low effects). This is because an uncached page access is 1000x slower than a cached one.
I recently had a server fall down and not come up due to IO overload. The more queries queued up the more *each query* got slower due to IO contention. This is another instance of this overloading effect. This would make for a nice simulation as well. I would like to see that and study the effect.
Comment by mark — February 17, 2016 @ 9:20 am
Thanks again Mark,
Another lesson I learned is that monitoring wait stats does give some advanced warning.
In my case (with blocked processes), I would see wait stats of
LCK_M_XXwhile in your case, you would seePAGEIOLATCH_XXwaits. And the good thing is that by monitoring wait stats, we can anticipate future trouble a lot earlier.Comment by Michael J. Swart — February 17, 2016 @ 12:14 pm
[…] Michael J. Swart has come up with a concurrency simulator: […]
Pingback by Concurrency Simulator – Curated SQL — February 19, 2016 @ 8:05 am
Very cool. Are you going to explain the math behind the simulator, or share the code? Is it something you could use to predict when real-world workloads will hit the wall where throughput stagnates and latency quickly increases? Looking forward to the rest of the series.
Comment by James Lupolt — February 20, 2016 @ 4:41 pm
Thanks so much James,
The code is in the webpage itself! Visit the page and in your browser, right-click and view source. (Coding the page was a small exercise for me in javascript and d3).
I haven’t done anything rigorous with the math. You may have noticed that things seem to go bad right around the 7200 processes mark which is exactly when the server get’s saturated (7200 processes * 0.5 seconds per process = 1 hour).
The bad news is that I don’t think that this can be used to predict when a server hits the wall. That’s the lesson I learned from this experiment. I really wish it was though. There is perhaps hope if your real-world workload is “spiky” and “uneven” because in that case, you might see infrequent “warning” episodes of blocked processes.
That leads to the question “What can be used to predict when workloads will hit the wall?” The best thing I have at the moment is monitoring wait stats for
LCK_M_XXwaits. I’ll try to add more in the third post of the series.Michael
Comment by Michael J. Swart — February 20, 2016 @ 5:20 pm