


This series includes a number of stand-alone posts which can fit together to tell a bigger story
- Part One: Types of Performance Metrics
- Part Two: What’s Going On Inside Tempdb?
- Part Three: Avoid Frequent use of TVPs With Wide Rows
- Part Four: Troubleshooting Tempdb, a Case Study
At work, we store error messages from our web servers in a database. Up until recently, we were loading them using procedures that use wide TVPs. We discovered that if we saw a large enough spike in errors, then we’d also see tempdb contention which would flood our error logging service with more errors. This positive feedback loop made our database server unresponsive and the system as a whole couldn’t recover without intervention. That’s the problem I tackled, and I want to explain my troubleshooting process.
The Troubleshooting Landscape
Let’s start at the beginning. Here’s an abstract visualization of how I see throughput and performance thresholds.
The blue area represents the load sent to the database. The red bars are examples of performance thresholds that can limit throughput. Based on hardware and configuration, those red lines can be moved up or down. The lowest red line is the performance ceiling. In this example, notice that adding more CPUs would not allow more throughput unless tempdb contention is also tackled:

The Troubleshooting Landscape
I like to show this graph to people in order to illustrate the implicit relationship between a database developer and a database administrator. There’s obviously a lot of overlap, but in general:
- The red lines are part of the DBA’s job. It is up to the DBA to provide and configure a database server that can support the load sent by the application.
- The blue area is part of the developer’s job. It is up to the developer to make most efficient use of the hardware given.
Happy databases are ones where the blue and the red don’t meet.
SQL Server DBAs are the only ones that have to worry about tempdb (Oracle and Postgres DBAs get a break).
But look at that tempdb contention limit. I like to point out to anyone who will listen that tempdb contention is Microsoft’s fault. Every minute spent on tempdb problems is time spent working around a defect in SQL Server. It’s frustrating. It’s already hard enough worrying about CPU and IO without worrying about logical contention caused by the database engine. I feel like this guy:

My Troubleshooting Workflow
So if you’ve been following my blog for the past few weeks, this is what I’ve been leading up to. With a ton of hindsight, here’s my workflow for troubleshooting tempdb contention:
Some of the early information in the early steps can be detected using sp_whoisactive, and some of the last steps are links to other parts of this blog series.
But…
The world is rarely as nice and predictable as we model it to be. Database load is no exception. Database load is not a smooth thing. It’s spikey and uneven and it consists of an unpredictable variety of queries.
Once when I thought that tempdb transactions per second was the best metric to watch, I captured this graph over a couple of days:
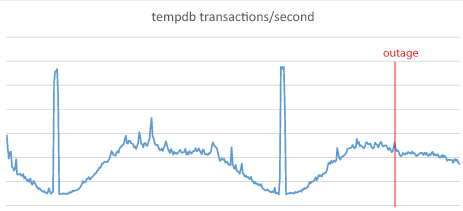
The outage seems unrelated to tempdb activity
The spikes in tempdb transactions correspond to nightly report runs or maintenance. But we experienced a database outage caused by tempdb contention during a period of time where tempdb usage should have been tolerable. This was an outage where practically no queries completed.
And that was puzzling to me. I knew it was had to be one of two things. Either
- the metric I was using – tempdb transactions per second – did not accurately reflect the activity that I wanted to measure. Or
- the database activity (both volume and variety) changed so suddenly, that I couldn’t measure it. It not only caused an outage, but it also prevented me from measuring the effect
It turns out that both ideas were correct. I embarked on a process to learn more about tempdb and that’s when I found out that wide TVPs were multipliers of tempdb usage. Taking that into account, I discovered that our error logging procedure was very very expensive. And it wasn’t too long to find that any spike in errors could quickly cause a feedback loop. So quickly that our servers couldn’t cope and couldn’t recover.
What We Did
We did a couple things. We isolated our logging database onto a separate server. Our logging service was adjusted to not use TVPs as frequently. This helped. Our tempdb slowdowns were no longer server killers, they were merely throttles. Another adjustment to the number of data files reduced our tempdb headaches to almost zero and this meant that we could finally focus on the next bottleneck in our troubleshooting landscape.
In the past few months, I’ve tackled this bottleneck and about a dozen others. In fact, if I had time enough, you’d probably see more posts like this one about troubleshooting and tackling performance challenges. After a lot of work by many people, we were able to support as much as 58K transactions per second and we’re really proud of that. It’s been a difficult but fun couple of months.
Thanks for reading. I hope you enjoyed the series.

[…] Troubleshooting Tempdb, a Case Study – Michael J. Swart (Blog|Twitter) […]
Pingback by (SFTW) SQL Server Links 18/09/15 - John Sansom — September 18, 2015 @ 5:55 am
[…] to be relatively slow to begin with, and they get much worse if they spill to tempdb. Really, tempdb is a common performance killer, so it’s not surprising to see some of the most expensive, performance-killing operations involve […]
Pingback by How To Troubleshoot Performance Problems | 36 Chambers - The Legendary Journeys: Execution to the max! — September 29, 2015 @ 6:01 pm
” Another adjustment to the number of data files reduced our tempdb headaches to almost zero and this meant that we could finally focus on the next bottleneck in our troubleshooting landscape.”
May i know what is that mean ? it means reduced the number of tempdB files ? it should just match the number of CPU core, right?
Comment by Myung — November 2, 2015 @ 11:31 pm
Hi Myung,
We actually increased the number of tempdb data files from 8 to 16 (and then subsequently to 24). But the number of CPU cores we had was actually greater than that.
It’s difficult to determine the number of tempdb files that is appropriate without a lot of context.
Paul Randal talks about this in his article A SQL Server DBA myth a day: (12/30) tempdb should always have one data file per processor core. In that article, he points out that that one file per core rule is sometimes but not always the best rule of thumb.
Comment by Michael J. Swart — November 3, 2015 @ 8:07 am